GEO 265 FINAL PROJECT
Salmon Restoration in the Tillamook Basin
Background
Salmon are a powerful image of the
Currently, there are significant efforts being undertaken to restore stream habitats to an environment favorable to the survival of native salmon. A lot of money is being spent and it is important that the money be allocated in ways that will produce the most "bang for the buck".
This project will take you through several types of simple spatial analysis. You will be answering questions of the sort asked by resource managers, fishermen, farmers and citizens throughout the Northwest.
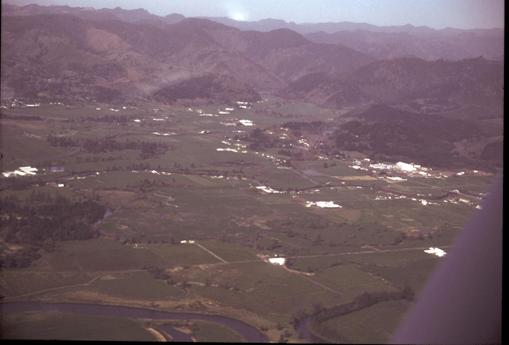
Photograph of a part of the
The
Data:
Part 1
The data for these exercises will come from the Tillamook Bay National Estuary Program. These data are available from the Tillamook county website, the data are stored at http://gisweb.co.tillamook.or.us/Current/Exports/.
Metadata for the data sets can be found at gisweb.co.tillamook.or.us/download/metadata/METADATA/.Useful background of GIS in the
Additional background on the salmon species we are considering can be found at
Washington Fish & Wildlife
Data you will need for this project are:
Coho (a map of streams which coho salmon Oncorhynchus kisutch are known to use)
Chum (a map of streams which chum salmon Oncorhynchus keta are known to use)
Tbasins (the watersheds for each of the river systems that
drain into
Owner (land ownership in the
Ms92clam (a classified Landsat MSS image, from which we will create a classification of land cover)
You may also want to download:
Fematveg (vegetation map created as part of a statewide vegetation mapping project)
Lroads (a complete coverage of roads in the study area)
Lstreams (complete stream coverage for the study area)
Digital Elevation Models (DEMs) from gisweb.co.tillamook.or.us/download/images/dem-sp/
The data on this site are compressed (zipped) ArcInfo export files. In order to make them useable you will have to BOTH uncompress (unzip) them and IMPORT the file into a form that ArcGIS will recognize.á When the files are uncompressed (unzipped) you will have a group of files with an .e00 extension. (e.g. coho.e00) these are ArcInfo export files. ArcInfo is famous for a complex file structure and unless the export command is used files can easily be lost and the whole coverage becomes corrupt. [Coverage is ArcInfo terminology, similar to shape files] To make these files visible to ArcGIS you must use the Import to Coverage utility in ArcToolbox. The icon for the Import to Coverage utility is found under the Start\Programs\ArcGIS\ArcToolbox\Conversion Tools\Import to Coverage. You will be using the Import from Interchange File command to import the export files into a coverage that can be used in ArcMap.
Task: Use the Import
from Interchange File tool to import the coverages to your working directory.
When you have the coverages imported, open ArcCatalog and look at the data sets. You will see both the map symbol for shape files and a map and file folder symbol that indicates several types of coverage files are available. To see what is available in an ArcInfo coverage in ArcCatalog, click on the icon for that specific coverage while clicking on the Contents, Preview, and Metadata tabs to observe the information available.You will need to decide which of these coverages you will need in your analysis.Load the data into your new map document in ArcMap.
Task: Using the Tillamook County GIS web site at http://gisweb.co.tillamook.or.us/ as well as other resources online, answer the following questions regarding the data to be used in this study.
1. In what projection are the data sets? Determine all the parameters of this particular projection and include these in your writeup.
2. Access the metadata for each of the data files you will be working with. This may take some investigative work. Include the following information in your writeup:
a. Who created it and when was the data created?
b. What was the original scale of the data?
c. Discuss the various aspects of the data that may be of concern when using the data in this analysis, especially in terms of currency, data completeness, spatial resolution and spatial accuracy.
3. In ArcMap, examine the data carefully. Are any problems with the data? You will need to decide how you will deal with these problems. Document your decisions regarding these problems in your write-up. HINT: Note the attribute information for each data set and which attribute information is important for the project because you will need it later on!
Spatial
Analysis:
Part 2. Before we can make good decisions regarding
the distribution of salmon recovery money we need to answer some simple
questions, such as how many miles of habitat streams do we have in each river
basin. As the process will be the same
for all basins, please select a single basin to evaluate (e.g. the
Task: Use the coho and chum files within your selected basin. For each species, how many linear units (kilometers or miles) of spawning streams are found in the river basin? What other types of stream use information are available? (Include this in your writeup).
Tools that may be useful for this task:
Select by Attributes
Select by Location
Selection Statistics
Layer Definition Query
Create a new shapefile from a selected set (Data>Export command)
Greoprocessing Wizard (under Tools menu) > Clip and Dissolve commands
Table queries (under the Options button on the table)
Symbolize based on Categories
Part 3. In order to evaluate the effectiveness and costs of mitigation programs it is necessary to determine how much of the land along the streams are in public versus private lands.Using these data create a new shape file with which we can extract other data about the landscape. We need to buffer the streams for each species within your selected river basin. The buffer zone will be 150 feet, the immediate zone of influence along the stream.
Task: Identify the percentage of public and private ownership along the habitat streams within the buffer zone (w/in 150 feet) for each species. What might be the reason for choosing a 150 foot buffer strip? What other factors may influence the size of the buffer? (Include this in your writeup).
Tools that may be useful for
this task:
Buffer Wizard (under the Tools menu)
Geoprocessing Wizard > Clip and Dissolve commands
Selection Statistics
Field Summary (within attribute table)
Creating charts from tabular data (Options button on attribute table)
Symbolize based on Categories
Part 4. Another very important factor we need to consider in this project is the type of streamside vegetation. Unfortunately the existing vegetation maps are unacceptable for this (examine the fematveg map if you wish to confirm this). We will use a simple classified landsat image (ms92clam.gis) to create our own vegetation map of the Tillamook basin. These operations will help you understand the relationship between image, raster (grid) and polygon data.
Tasks: You
must first use the classified Landsat image (ms92clam.gis) to create a
landcover/vegation map for the
Note again: When landcover classes for the image have been determined, you must convert the image to a grid for analysis.
Suggested landcover categories:
- Grass/Shrub Lands
- Water
- Development and Other
There are several options for spatial analysis using grid and polygon coverage. Your buffer polygons (created in the previous step) can be used directly with a grid by using an additional extension or script. Search the ESRI website for a script or extension that will allow you to clip a grid with a polygon (Hint: Go to http://arcscripts.esri.com/ and type in Multi-Bands Raster Clipper v1.0. Read about this tool to understand its functionality. Download the tool to your working directory and unzip the files. Next you must add the tool to the ArcMap interface- for help please ask the instructor.) *Alternatively, you can convert your grid into a polygon coverage or shapefile (note the change in shape from square pixels to polygons) and then use the clip function. Then make your determination of landcover areas. Note that you will need to calculate an area for each pixel within the grid to calculate the area for each landcover class.
Tools
that may be useful for this task:
Adding extensions
Converting Raster to Vector with the Spatial Analyst Extension
Basic image interpretation skills
Adding/calculating fields within a table
Use the summary functions to chart the area.
Loading, compiling, and running an ArcObjects script (http://arcscripts.esri.com/)
Project Report:
In your write-up, following the guidelines provided for the final project, please summarize your findings (results). Use maps and charts to strengthen and clarify your findings.
The writing for your final project is meant to simulate the experience of writing a professional
report as a GIS analyst (perhaps for a consulting firm that you will work
for upon graduation)! Therefore, PLEASE:
You will be graded on the following:
Writing style (20%):
Any style is ok as long as it is complete, readable, references cited,
and figures/maps referenced. Are
complete paragraphs used? A list of
steps is not acceptable. Is the writing
clear, can I understand what you are saying?
Were all five elements (Introduction, Methods, Result, Discussion and
Reference) discernable and complete?
Reporting data and results (50%): Data can be written in report or displayed with a map. Tables, charts, and other figures work well with text to describe data.
- Methods should include descriptions of criteria and
how GIS was used to accomplish the goals of the project. Is there evidence that clipping,
buffering, classification and other analysis tools were used? How was GIS used to conduct
the analysis? Can this be
determined from the write up and/or from a map?
- Must be at least one map (study area) showing the greater Tillamook region and the selected watershed in the context of Oregon, Pacific Northwest, or United States/North America. This map should be described or referenced in the introduction or methods (e.g., Figure 1). A locator map is essential for this kind of map to help readers understand where Tillamook and your watershed are in the world.
- Results must include one or more maps showing your selected river basin. Maps that zoom in to a specific area of interest (your river basin or part of) must have a locator map showing where in the greater Tillamook region the zoomed area of interest is located. Maps that zoom in to parts of your selected basin must have a locator map of the entire basin showing where the zoomed area is located. Results must include how many linear units (kilometers or miles) of spawning streams are present in your river basin for each species. In addition, report the percent of each owner class (public and private) and report the area and/or percent of each landcover class in the immediate zone of influence for each species. Charts and tables are very useful in presenting this type of data and are easy to add to map layouts. Include maps showing landcover and ownership for each species. Make the maps large enough so that landcover and ownership can be clearly seen. If size and space is a problem on your layout, you may show a part of your selected basin (zoom in) as an example of landcover and ownership along streams.
- Discussion should include the management implications (e.g., preserving private land vs. public land). Discuss implications for each species. This should not be complicated.All you know from this project is stream length, land ownership and landcover. You only need to address the ownership and landcover that exist along the streams "zone of influence".
Map(s) (30%)
- Basic map elements (neat line, title, north arrow, credits, scale bar, legend)
- Clear and complete titles on maps, legends, and figures.
- Style and clarity - Is the area of interest the largest map? Is the layout balanced? Are map features and labels readable? Is the focus or primary subject of the map discernable?