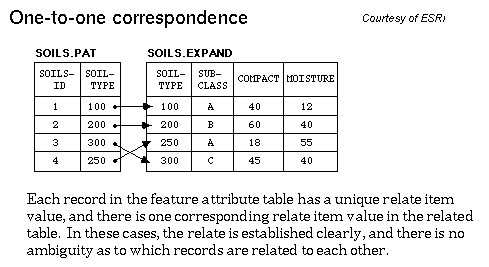
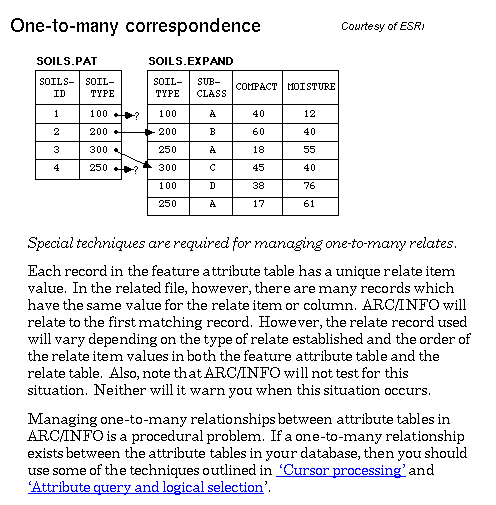
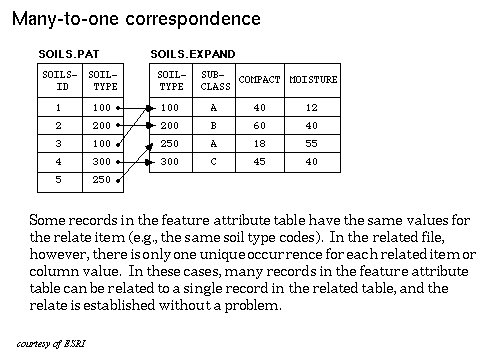
Relationships are divided into four groups, based on the relationship's
cardinality -- how many features in the coverage are related to how many
attributes in the related table:
 |
Suggested time for completion: Two weeks
To review general GIS applications, including:
This lab will introduce you to several analysis methods -- many of which you will have used in previous GIS courses or work, or have experience through a lecture setting. As much of the material will be review, it will not all be covered in extreme detail (but the the specifics of using the tool or analysis method in ArcInfo 8 will be covered).
Buffers: A buffer is a polygon surrounding a point, line, or polygon at a set or varying distance. Buffers are used for proximity analysis -- for instance, finding all of the neighbors within 1000 feet of a new construction project.
Dissolve: Dissolve merges adjoining features to form new regions based on a common attribute. This is occasionally referred to as aggregating data.
Clip: Clip allows for the "cookie cutting" of a coverage to a specified area. For instance, a coverage of the Santa Barbara city limits could be used to clip a county wide roads file -- after the operation, only the Santa Barbara city roads would remain.
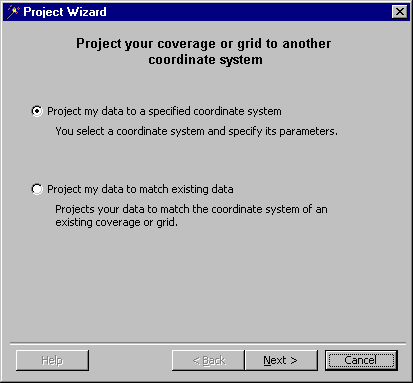
Data projection: Project is used to define the projection for a coverage, or to change the projection for a dataset to match an existing dataset or to a user specified projection.
Data projection is central to work with geographic data. How should a 3-dimensional object be represented on a 2-dimensional surface? A projection makes this possible. In any projection, there will be at least one of the following forms of distortion: area, angle, distance, and/or direction. Each projection has its pros and cons, primarily related to which of the four are distorted or preserved. Additionally, projections are often chosen for aesthetic reasons -- certain projections are more useful for display of certain regions. For example, you would not want to use a cylindrical projection to display areas of high latitude.
Joining data: Joining tables allows for assigning new attributes to a spatial feature based on common fields in tables.
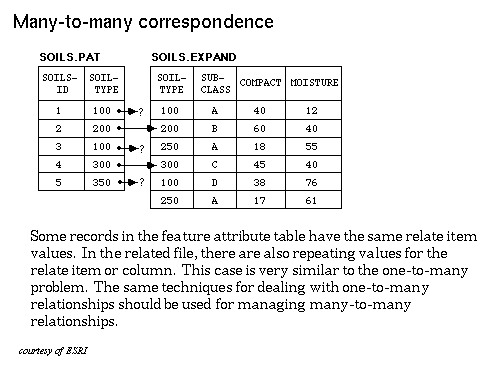
Look up tables (LUT) / relationship classes: Relationship
classes provide similar results to that of joining data, however, data
in the tables are not actually merged. A symbolic link is created
between two tables sharing a common field, allowing the data from the other
table to be accessed based on a common key. Essentially, a relationship
class allows a temporary connection between features in one coverage, and
attributes in another table. ArcInfo 8 relationship classes also
allow for rules to be set between the related tables.
Relationships are divided into four groups, based on the relationship's
cardinality -- how many features in the coverage are related to how many
attributes in the related table:
|
Further, relationships can be classified as either simple or composite
relationships:
|
Coverages:
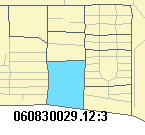
bound06083 -- Boundary coverage for Santa Barbara County (06083)
blockgroups -- Coverage containing Census blockgroups for Santa
Barbara County
place06 -- Coverage containing place boundaries for the state
of California (06)
street06083 -- Coverage containing GDT's Dynamap/2000 street
files for Santa Barbara County (06083)
Shapefiles:
iv_parcels -- Shapefile containing parcels in Isla Vista, CA
iv_roads -- Shapefile containing roads in Isla Vista
iv_buildings -- Shapefile containing building footprints for
Isla Vista
Other:
tractdata.dbf -- database file containing attributes for the
census tracts in Santa Barbara County
Copy the data to your local work folder.
3.4.1 Buffers
A buffer is useful for determining whether a point/line/polygon
falls within a certain distance of another point/line/polygon. In
this example, we will use two different methods to create a buffer to determine
which properties fall within a certain distance around another property.
In the first step, we will create a new layer consisting of a polygon of
the buffered area. This new polygon can be used for selection of
datasets or for graphic display. In the second step, we will select
all of the polygons that fall within a buffer region. This type of
analysis is useful for identification of areas and report generation.
Buffer analysis is often done in fields such as city and regional planning. For this portion of the lab we will use our Isla Vista property data.
First, convert the iv_parcels, iv_roads,
and iv_buildings shapefiles to coverages (this might be a good time
to experiment with the batch option if you would like to learn how to process
all of the shapefiles at the same time).
| Turn in the first page of your report with your lab. Make
sure that the report is readable and well organized.
Answer question 1: For what do you think this analysis would be used? How would two methods used be useful in different ways? Answer question 2: Name at least two other projects which would benefit from buffer analysis. |
3.4.2 Clip - In this
section we will learn about clipping data so that the spatial extents match.
This is useful to remove extraneous portions of a coverage.
|
| Answer question 3: Why might clipping data not always be the best method for obtaining data? (Think in terms of accuracy and data scale / resolution). |
| 3.4.3 Dissolve
As an example of the dissolve function we will
use the dissolve function to dissolve blockgroups into tracts. Census
geographic divisions are organized in a nested hierarchy as follows: Nation
-> Region -> Division -> State -> County -> County Subdivision -> Tract
-> Block Group -> Block. Each level down marks a smaller measurement
area, none of which overlap -- for instance, no area is in two different
block groups, counties, or states, etc.
|
| Answer question 4: Explain the difference between "Dissolve" and "Dissolve Regions." Which did you select? Why? |
| 3.4.3 Dissolve (Cont.)
Once you have selected the tool that you want to use for this job, double click to start the tool. Add the blockgroups coverage as the input coverage. Pick the appropriate dissolve item (the item in the attribute table that defines which polygons should be dissolved into one polygon), set the output coverage (pick an appropriate name for your file) and click OK. Note: When setting output coverages (or creating new coverages,
etc), be sure that you are saving the coverage in the correct folder!
If you just type in the file name it may not save to the correct folder
-- to ensure that you save your data to the correct location, place your
mouse over the Examine both the geography and attribute table for your new coverage (use the Preview tab). |
| Answer question 5: What happened in the dissolve? What has changed in the geography and the attribute table? Why do you think that this happened? |
3.4.4 Projections
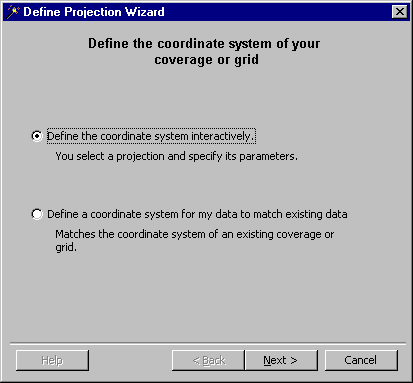
If a coverage does not already have a projection defined, the Define Projection Wizard is used to define the projection. The wizard allows for the projection to be defined interactively, where the user selects the projection and all of its parameters, or the projection can be defined based on the projection information for another dataset. This only works if the two datasets are in the same projection and have the same parameters. For either method, you must already know, or
have a good idea of the coordinate system being used for the data.
Some hints on identifying coordinate systems can be found in the links
listed at the end of this section.
|
| Answer question 6: The bound06083 data set does not yet have a projection defined. By looking at the properties of the dataset, determine the correct projection and define it using the "Define Projection Wizard." What ESRI "projection" is bound06083? (Hint - the coordinates of the tic marks may provide a clue as to the coordinate system) |
For more information on
projections and coordinate systems:
|
| 3.4.5 Joining data
When we dissolved the blockgroups into tracts in section 3.4.3, some of the attributes disappeared. Fortunately, we have a table with data for the new tracts coverage (tractdata.dbf) -- but we need to join it to the new tracts coverage in order for to be useful. To join data, use the Join Tables feature in ArcToolbox. Your input table is the table to which you want the new information joined -- in this case, the polygon attribute table (PAT) for your tracts coverage. Your join table is the table containing the information to be joined -- the join table must also be a feature attribute table. We have a .dbf file containing the new attributes for the tracts coverage -- this will not work in Join Tables, so we must convert it to an "INFO" file. To do this, in ArcCatalog right click on the .dbf file, and Export --> dBASE to INFO. In order for a join to take place, the field name of the key field must be the same in both the input and join tables. Check to make sure that the join fields in the tracts PAT and the INFO file have the same name. If not, edit the INFO file field name so that they match (right-click on INFO file, --> Properties, --> Items tab, select the field, and --> Edit). Use a Linear join method, and use the default output table (it will write over your existing tracts PAT, joining the data). Examining the new attributes
Normalizing data
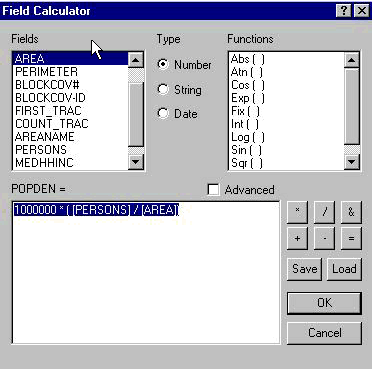
Using ArcMap, open the attribute table for your tracts coverage (right-click, Open Attribute Table), and also Editor --> Start Editing (you may need to open the editor toolbar to do this). Right-click on the POPDEN field, and select "Calculate Values." Using the field calculator, calculate a value for the new POPDEN field as: POPDEN = 1000000 * ( [PERSONS] / [AREA]) -- we multiply by 1000000 to convert to square kilometers because the units are in square meters. Make sure that the new values look correct, if so, Stop Editing and save your edits, and then change the draw symbol for the tract polygons to graduated color for the POPDEN values. |
| Answer question 7: Find the census tracts with population densities greater than 16,000 persons/km. Are the density values higher than you expected they would be for these areas? Explain why you feel these values may be spurious. |
| 3.4.6 Relationship
classes
Creating a relationship class table The street06083 coverage provided in this lab lists, for each street segment, the CFCC -- the Census Feature Class Code. The CFCC denotes the road type for the segment. We want to know the actual road type (such as "paved, two lane") rather than the representative code, so that we can use these to classify the roads. To do the classifications, we will need to create a look up table (LUT) with the CFCC values and their matching road description. We will create the table using Microsoft Excel. Finding the data We are using US Census TIGER (Topologically Integrated Geographic Encoding and Referencing) street files. We can find the CFCC descriptions through the Census TIGER description document. Using the definitions provided, create a table with CFCC and description fields. You will want to condense the descriptions into broad categories (i.e., Primary Highway, limited access -- rather than using the individual descriptions for each CFCC in that category). Note: The CFCCs in the roads coverage run from A11 -- A73. When you have finished entering the data into your new table, save it to your working directory as a DBF 4 file (.dbf). When your file is saved, make sure that it appears in your directory in ArcCatalog (you may need to Refresh the view). Right click on your new table, and export dbase to INFO. (You will need to have the file closed in Excel to do this.) Note: When exporting, make sure that the INFO description field will be wide enough for your descriptions (click on "Define Mapping" and go to the dbase description field to check the item width). Once you have your info file, check to make sure that the fields appear correctly. You are now ready to set up a relationship class using your new LUT. Setting up a relationship class Setting up a relationship class is quite simple -- right-click on the coverage for which you want the relationship, then select New --> Relationship Class. Give the new relationship class an appropriate
name, and set your Info table as the origin and your street06083
file as the destination. This is a simple relationship, with no messages
propagated, and you do not need to add attributes. You will need
to figure out what type of relationship this is (one-to-one, one-to-many,
or many-to-many), and which fields to use for the relationship.
|
| Answer question 8: What type of relationship is this? Which
fields were used?
Answer question 9: Give at least one example of where it might be better to use a relationship class rather than a join. |
| Using the relationship class
To use the relationship class, add your roads coverage to an ArcMap file. Open the Properties for the coverage. Select the Joins & Relates tab, and add your relationship class as a Join. When you have done this, click OK. Now you should be able to access the fields in your related table. |
| Your map for Lab 3:
Create a map of the Santa Barbara County roads, classified by road type. Make use of the Properties --> Symbology tab to choose logical symbols for the different road types. |
In this lab you have learned about many of the analysis options provided in ArcInfo 8. These analysis methods will be frequently used in "real world" GIS analysis. Keep in mind, however, that while is it useful to understand how to use these analysis tools, it is also useful (perhaps more so) to ensure that you have a solid grounding in the theory behind the analysis.
Last update: April 8, 2002
http://dusk.geo.orst.edu/buffgis/Arc8Labs/lab3/lab3.html