GEO 580


LAB 5: Network Analysis

Instructions below updated for ArcGIS 9.3
Click here for ArcGIS 9.1/9.2 version

Suggested time for completion: One week


Outline:


5.1.  Purpose

5.2.  Introduction and background

     ArcGIS 9 provides fairly comprehensive utilities for network analysis.  This lab is designed to introduce you to the basics of networks, including setting them up for analysis, and actually using them.
 

The components of networks:
  • Edges -- The easiest analogy for an edge is an arc.  An edge is a feature that has some associated length, and through which a commodity flows (water, oil, electricity, people, and so forth).  Like an arc, an edge has two junctions (nodes), however, the intersection of two edges does not imply a junction -- for instance, in a coverage, the edge/arc representing a freeway overpass will cross over the road going underneath, however they do not intersect with one another. 
  • Junctions -- Where an edge only has two junctions, a junction can have any number of edges.  A junction allows for the transfer of a commodity from one edge to another. 


Network rules:
     In the creation of a network, rules governing the connections of edges and junctions can be set.  These rules fall into two categories:
  • Edge-junction rule -- An edge-junction rule governs which edges can connect to which junctions.  For instance, a 240 volt edge can not connect to a 120 volt junction.
  • Edge-edge rule -- An edge-edge rule governs how, and through what type of junction two edges can join.  For instance, the 240 volt edge can not meet directly with a 120 volt edge unless the edges meet through the proper volt adjusting junction.


Weights:
     A weight is a value of "cost" associated with travel on or through an edge or junction.  Weights can be assigned to either edges or junctions, and any edge or junction can have more than one assigned weight. 

Examples of weights (in transportation networks):

  • Edge -- edge length / speed limit = travel time.  The travel time would represent the overall "cost" of traveling along that edge segment.
  • Junction -- stop light wait time.  The average wait time could be used as the "cost" of traveling through that intersection.


Barriers:
     A barrier is a symbolic flag placed on the network that signifies that the edge or junction is blocked, and thus the route must find another path around. 


Sources and Sinks:
     Sources and sinks are used in network analysis to establish flow direction in a network -- i.e., if the Edge C can only be traveled from junction A to junction B, or if junction A indicates the source of all flow, and so forth.

  • Source -- The junction at which flow originates
  • Sink -- The junction at which flow stops

 
Utility Network Analyst

  • Network -- for selecting the network feature with which you wish to work
  • Flow -- for turning on or off arrows indicating the flow of each edge in the network
  • Analysis -- for enabling/disabling layers for analysis, clearing flags/barriers/results, or for modifying various options for the analysis (weights, etc.)
  • -- for setting junction flags, junction barriers, edge flags, and edge barriers in the network
  • Trace task -- for selecting the type of analysis that you wish to do 
    • Find common ancestors  -- find common features upstream from selected junction
      • Similar: Find disconnected 
    • Find connected -- find all of the edges and junctions that are connected to a selected feature
    • Find loops -- find all of the loops that make up paths between junctions
    • Find path -- find a path between two points
      • Similar: Find path upstream
    • Trace downstream -- find all of the network junctions and edges that lie downstream of a feature
      • Similar: Trace upstream
      • Find upstream accumulation 
  • -- for "solving" network analysis

 
Answer question 1:  Provide at least one example of a network analysis problem for five of the above listed trace tasks (find common ancestors, find connected, etc.)


     While the network functions in ArcGIS 9 are primarily designed for work with utilities (as can be seen in the build geometric network wizard's text that "a geometric network allows you to model the behavior of utility networks such as electrical or water networks), the included network tools can be used to an extent on any suitable data.  For this lab, we will be creating a highway network and exploring network capabilities for transportation.


5.3.  Data

Download the data here (2.4 Mb) into your local work folder.


5.4.  Procedures

Please don't forget to TURN ON the NETWORK ANALYST extension!!

     In this lab, we will be building a transportation network based on a highway coverage for the the Pacific Northwest (asmnt_st).  This network will allow us to find the "best" path to various locations.

5.4.1 Preparing the highway coverage

Note: Any modifications to a coverage must be done before the creation of the network.

     Examine the attribute table for the asmnt_st coverage.  Note that there is field for average speed limit (Speed-Limi) ***.   You will create a Length_Miles field based on the LENGTH field. These two fields will be combined to create a weight field describing the length of time it takes to traverse each segment of the network. 

     First we need to create two new fields in the table, so open asmnt_st in ArcMap.

Open its table, Click Options and add a new field named "Time_Used", and a field "Length_Miles".  Both fields should be of type Float, and use default settings. (You might need to close out of ArcCatalog first)

First use the field calculator (Calculate values) to convert the meters values found in LENGTH into units of miles in the Length_Miles field. (Remember to right click on the field name to bring it up, the conversion is ~1609.344 meters per mile)

     Now right click on the Time_Used field and select the field calculator.  Use the SPEED_LIMI and Length_Miles fields to calculate the value for Time_Used.

     Once the calculation is complete, save your edits and stop editing.  You should now close ArcMap, you do not need to save the map file.

***SPEED-LIMI does not reflect actual speed limit.  It has been invented for the purposes of lab analysis. 


Answer question 2:  Why did we set the new Time_Used field to type Float?  Why not Binary, Number, or Integer?

Answer question 3: What formula did you enter into the field calculator to calculate the new Time_Used value (write it as you entered it)?  Why do we want to use this value, rather than either Speed_Limi or Length_Miles alone?


5.4.2 Creating the highway geodatabase

     Network analysis can only be done with a geodatabase, so a personal geodatabase must be created before the highways can be converted to a network.

Open up ArcCatalog

     Right-click on your workspace folder select New --> Personal Geodatabase.  Assign an appropriate name to your new geodatabase (for instance, HwyNets). 

     Right-click on your geodatabase and add a new feature dataset (name highways) to hold the highway data.  Import the asmnt_st coverage's spatial reference information (under the new feature dataset properties) for use in the feature dataset.

     Right-click on your highways feature dataset, and import the highways coverage to your geodatabase. 

(see note on possible bugs below)


Possible bugs:
  • It may be difficult to create the network -- there might be a write lock problem in the software (even if the file has not been used, it seems to be "in use").  If you have this problem, close all ArcGIS modules, then re-open them and try again.  If this doesn't work, restart and try again.


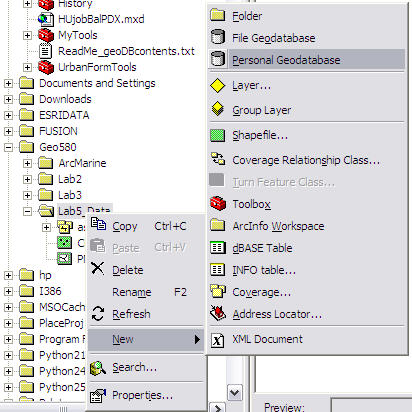
5.4.3 Setting up the highway network

DISTANCE ED STUDENTS: STOP HERE! If you are using the student version of ArcGIS 9, sent to you by E-Campus, please use these substitute instructions from this point in the lab onward. And see here for the fix to a possible bug.

All other students, PRESS ON!
 
     To create the actual highway network, we will use the Build Geometric Network Wizard.

 Right click on your feature dataset and select new-> Geometric Network

      After reading the introductory screen, click on Next.  Click Next again to build a network from existing features. Select the asmnt_st arcs (or whatever you named it) as your feature class from which you want to build your network.  Enter an appropriate name for your new network.

     You do not want complex edges in your network,  the network features do not need to be snapped, and we want to use weights (Speed_limi: type integer, LENGTH: type single, and TIME: type single.  Do not fill in the bitgate size field.  To add a new weight, click on the  icon).

     Select next, and assign weights to the fields in the feature class as follows:
SPEED_Limi::Integer -- Speed_Limi
LENGTH::Single -- Length_Miles (or as you named this field above)
TIME::Single -- Time_Used (or as you named this field above)

Select next until you finish

Note - If you did not define your fields with the correct type (i.e. integer, float, etc..) you may have trouble with this step.

     Finish the network building.

     If you bring up your geodatabase again in ArcCatalog, you will see new icons representative of the newly created network.

      Now open ArcMap, and add the highway network feature dataset (the one you just created).  With the dataset added, you should have both highway junctions and edges displayed.
 

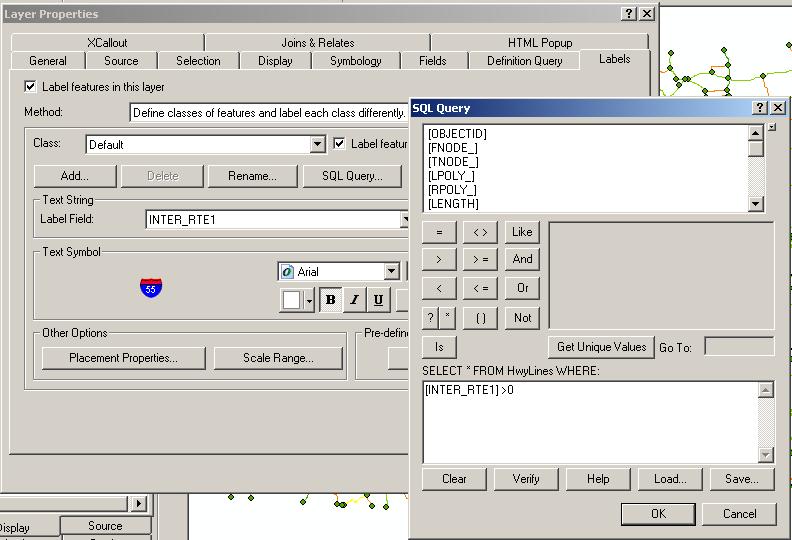
5.4.4 Displaying the highway network
  • Display the highway edges (arcs) according to the segment speed limits (unique values symbology).
  • Add highway markers as labels . This is a good time to explore the label placement options available in the labels tab of the layers properties. - Try limiting the number of markers to interstates with SQL and set the Label Placement Options to display the symbols on top of the roads, and horizontal to the page, not the lines they are based on.
  • Add the pnwstates shapefile as a backdrop for your network.
  • Bring up the Utility Network Analysis toolbar.


5.4.5 Network analysis

Find path (part 1)

     We are now going to run some simulations with the network analyst.  You are now the proud owner of the Pacific Northwest Hazardous Waste Delivery Service. Your fleet of trucks needs careful planning to ship deadly toxins from municipal HazMat sites to regional centers. In our first case, a research hospital in Seattle has a large supply of slightly radioactive heavy metals from their new x-ray laboratory. You need to determine the most efficient route to transport the material to the regional center located in Ogden, Utah..
 
 
  • We will consider the junction of I-5 and I-90 as representative of our location in the city of Seattle, and the junction of I-15, I-84 just south of Ogden as the nearest point to our hazardous waste facility.
     To plot the path, we need to place flags at the "Start" junction (Seattle), and at the "End" junction (Ogden).  The flags must be placed in the order in which stops will be made (i.e., Start -> End). Try zooming in to see the appropriate intersections.

     Go ahead and place the Seattle and Ogden junction flags.

     Select "Find Path" as the trace task, and click on the "solve" button.  . The results might be difficult to see unless your roads are not too coarsely displayed.


Answer question 4: What did this do?  What does the path look like (where does it go)?  What might be "wrong" with this path in terms of it being the shortest route?

 
Find path (part 2)
     Now let's try running the same analysis, except using the weight fields that we created earlier in the lab.  To set up the network to use the weights, click on Network Analyst Toolbar --> Analysis --> Options.  Select the Weights tab. 

     Under "Edge weights" set both to-from and from-to weights to Speed_Limi.  Since we do not have any junction weights, leave the junction weight as <None>.  Click on OK.  Now re-run the find path operation.

     Try calculating the path using each of the three weights that we set up (SPEED_LIMI, TIME, LENGTH).


Answer question 5: Describe the difference between the paths created using the three different weights.  Why do you think they differed?  Which one should we use for our path to the waste facility?

 
Barriers!
     Unfortunately for our company, the poor condition of the bridges in Oregon have made it politically impossible to send our waste through Oregon. The risk of an accident is too high according to the Oregon department of environmental quality. A path should be found with barriers in place.
  • To represent this, use the suitable flag from below to create barriers along all the road segments entering Oregon from the North.
  • To add these barriers, use the  Edge barrier flag, and the  Junction barrier flag.  These flags are placed in the same way as the junction and edge flags.

Side trips
     Unfortunately our trip is more complicated than this. We need to retrieve waste from not only Seattle, but Eugene, Spokane, and Billings before stopping in Ogden. Fortunately, ODOT (Oregon Department of Transportation) has agreed to allow our vehicles to utilize the Oregon roads as necessary. Clear the barriers using the analysis menu in the newtwork toolbar.

       Create a multi-stop path (or a path that must go through certain junctions) - simply place a junction flag on the junctions to be visited -- remember that the flags must be placed in the order that the stops will be made. 

  • To clear your previously placed flags, click Analysis-->Clear Flags on the Network toolbar.
  • To clear your previously placed barriers, click Analysis-->Clear Barriers on the Network toolbar.
Note: In order to "save" your results, you will need to change how the results are returned. Under Analysis --> Options, select the Results tab, and choose Return Results as Selection in the Results format section. You will then be able to export or create a layer from the selected features.

 
Your map for Lab 5: 
     Make a map of the journey to turn in. 

 
Answer question 6:  You have been hired to do network analysis to coordinate delivery for a local pizza parlor.  What data sets would you need/want, what would the data sets need to contain (i.e., what fields would you require for your analysis), and how would you set up the network for use? (This question requires a fairly detailed answer so spend a bit of time thinking about this one.)


5.5.  Conclusion

    In this lab, you learned about basic network analysis -- including creating and setting up a network -- in ArcGIS 9.


5.6 To turn in

Lab originally created by Nicholas Matzke and Sarah Battersby
UC Santa Barbara, Department of Geography
© Regents of the University of California; redistributed by permission
Modified by Dawn Wright, Jeremiah Knoche, Michele Dailey, and Tracy Kugler, OSU Geosciences

http://dusk.geo.orst.edu/buffgis/Arc9Labs/Lab5/lab5.html