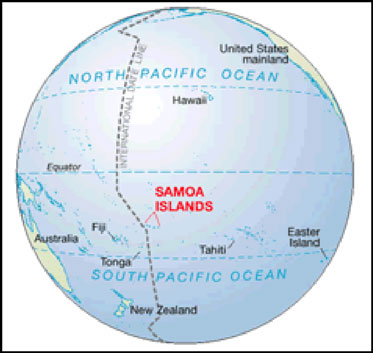
American Samoa is a chain of five volcanic islands and two atolls located at approximately 178° W and 14° S in the South Pacific, west of Fiji and north of New Zealand (Figure 1).
Continued concern over the ecosystem health of the coral reefs in American Samoa, including the Fagatele Bay National Marine Sanctuary, prompted several multibeam missions to map and study the region (Figure 2) (Wright et al. 2002). To effectively plan and manage needs related to coral reefs in these locations requires an accurate assessment of the abiotic and biotic environment, including accurate base maps (Wright et al. 2002).
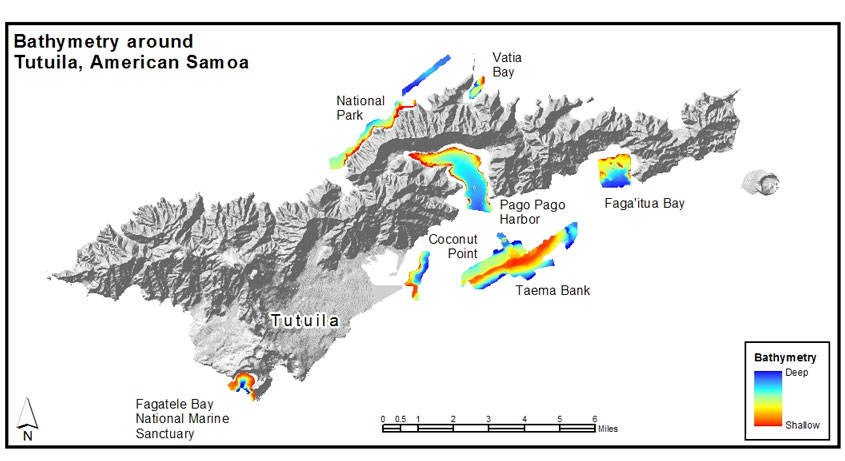
To generate these base maps two shallow water multibeam surveys were conducted in 2001 and 2002 using a Kongsberg-Simrad EM-3000 system (Wright, 2002b; Wright et al. 2002). A total of seven sites were surveyed including: Fagatele Bay National Marine Sanctuary, Cocunut Point, Taema Bank, Fagaitua Bay, Pago-Pago Harbor, Faga+itua Bay, National Park and Vatia Bay (Figure 2.). Once the data was collected and post-processed several techniques were used in combination to create benthic terrain maps.
Benthic terrain maps move beyond a simple representation of bathymetry, providing classifications that use intuitive landscape descriptors such as +reef crest+ or +reef flat+. However these terms are often used without any quantitatively described features. Without a quantitative description features classified by one investigator can often be very different than those described by another investigator (Coops 1998). The BTM was created to fill this need for repeatable, quantitatively described benthic terrain maps. Many of the techniques of the BTM are drawn from a similar process developed by Iampeitro and Kvitek (2002).
The BTM is an ArcGIS 8.x compatible tool that creates a user defined classification system of benthic terrain. The classified product transforms digital elevation data, which is generally gathered with a multibeam echo sounder, into a classified product for use in research or natural resource management.. However the principles behind the tool are general enough to be used on any digital elevation data. The inclusion of a flexible and customizable terrain dictionary allows investigators and managers to create benthic terrain maps in a variety of benthic environments, not just coral reef dominated ones.
There are no minimum hardware requirements other than those suggested by ESRI for the ArcGIS 8.x platform with the Spatial Analyst extension. However it is worth noting that the analysis, especially the Bathymetric Position Index grids, can be time consuming for large datasets, even on fast ( >2.0 GHz) processors. The user must also maintain some free space on their hard disk as this program can use several hundred megabytes up to a gigabyte or more of hard disk swap space during the analysis. In general, as the number of rows and columns in the grid increase so does the processing time and hard disk requirements.
Several processing optimization steps have been included to reduce processing time and increase productivity. These include a built in grid re-sampler and the option to save and re-use certain intermediate step grids for re-iterative analyses. The tool itself is in the various stages of software development. Upon completion, it will be freely distributed and available for download from the Fagatele Bay National Marine Sanctuary GIS Data Archive located at http://dusk.geo.orst.edu/djl/samoa/ .

A potential disadvantage of this system was limiting the more advanced spatial analyst. To avoid this situation the BTM allows the option to create a customized terrain classification dictionary as well as the option to save the grids that are produced at several intermediate steps before the final grid is produced.
Since the terrain classification dictionary is stored in the XML format the user may either chose to create/modify a classification dictionary using the GUI in the BTM tool or they may edit the XML document directly with a text editing program like Microsoft Notepad. The XML format is simple to learn. Users that have experience with HTML (Hyper-Text Markup Language) or CSS (Cascading Style Sheets) will have little difficulty working with this format.
Another advantage of the customizable terrain classification dictionary is that the same classification parameters can be shared between different users thus ensuring a level of consistency in benthic terrain terminology being used between different users and user groups.
A default classification scheme is included with the BTM. The default classification was used in preparing detailed benthic terrain maps for six locations in American Samoa (Figure 2). The default is intended to be a template, and will not necessarily yield accurate results across a variety of spatial scales. Therefore, the user of the BTM is encouraged to find a classification scheme that fits their needs and customize it to be appropriate for the scale of processes and phenomena under investigation.
The BPI analysis used in the BTM is a roving local annulus calculation (Figure 4). The annulus is defined by the user and starts in the cell adjacent to the center cell ad extend outward, or the analysis can create a +dough-nut+ shape around the focal cell by giving the analysis annulus an inner radius value greater than one cell value. The height of each cell in the DEM is compared to the heights of neighboring cells within a user defined annular area.

This tool calculates a fine scale and a coarse scale BPI grid. These two grids are then merged into a single BPI composite grid that takes into account coarse features and fine features to capture the cross-scalar spatial heterogeneity of terrain features within the DEM.
The calculation process starts with a cluster of nine grid cells. The center grid cell is the unit whose value will be calculated based on its relation to its eight neighboring cells (Figure 5). A simple triangle is created by linking the center points of two grid cells to the central grid cell+s centroid then the resulting triangle+s area is calculated. A triangular area is created for each of the cells surrounding the center cell. Next the triangle is truncated so that only the portion of the triangle that covers the center cell is used, and the portion of the triangle that covers cells adjacent to the central cell are discarded. Then the areas of all eight truncated triangles are calculated and summed for comparison to the planimetric area of the center cell. This simple ratio of truncated-triangle area versus planimetric area has a minimum value of one while typical values range from one to three although larger values are possible in very steep terrains.


The processed-grids were brought into the ArcGIS 8.x program and analyzed using the same methodology as the BTM (Figure 7). First, BPI grids at fine and coarse scales were generated and standardized. Next, the BPI grids were combined along with slope and depth to generate a benthic terrain map (Figure 8). This benthic terrain map can be augmented with rugosity to create an enhanced benthic terrain map. A rugosity map that has not be combined with benthic terrain data is shown in Figure 9. These, or similar, classified maps are intended for use by the members of the ASGIS, which includes the Fagatele Bay National Marine Sanctuary, in natural resource planning efforts (Wright 2002a). These benthic terrain models will be ground-truthed and assessed for accuracy in upcoming (2005) submersible dives in American Samoa.


Planned improvements for a future release version of the BTM include the additional parameters of slope-aspect, and simple light attenuation with depth at user specified electromagnetic radiation frequencies, as well as the analysis of multibeam backscatter data. These improvements have potential for increasing the accuracy with which benthic terrains can be classified based on information gathered with multibeam sonar systems.
Iampietro, P., and Kvitek, R., 2002, Quantitative Seafloor Habitat Classification Using GIS Terrain Analysis: Effects of Data Density, Resolution, and Scale (Conference Poster). (GeoHab 2002).
Jenness, J., 2003, Grid Surface Areas: Surface Area and Ratios from Elevation Grids [Electronic manual]. Jenness Enterprises: ArcView® Extensions, http://www.jennessent.com/arcview/arcview_extensions.htm
Weiss, A. D., 2001, Topographic Positions and Landforms Analysis (Conference Poster). (San Diego, California: ESRI International User Conference). Indus Corporation. Aweiss@induscorp.com
Wright, D., 2002a. Mapping and GIS capacity building in American Samoa, Proceedings of the 22nd Annual ESRI User Conference , San Diego, CA, Paper 101.
Wright, D.J., Mapping the Seafloor in American Samoa, Geospatial Solutions , 12(7): 24-25.
Wright, D. J., Donahue, B. T., Naar, D. F. ,2002, Seafloor Mapping and GIS Coordination at America+s Remotest National Marine Sanctuary (American Samoa) in Undersea with GIS. ed. Wright, Dawn J Redlands: ESRI Press., pp. 33-63.
Dawn J. Wright
Professor
Department of Geosciences
104 Wilkinson Hall
Oregon State University
Corvallis, OR 97331-5506
Telephone: 541-737-1229
Fax: 541-737-1200
Email link
Emily R. Lundblad
Graduate Research Assistant
Department of Geosciences
104 Wilkinson Hall
Oregon State University
Corvallis, OR 97331-5506
Telephone: 541-737-8818
Email link
Emily M. Larkin
Graduate Research Assistant
Department of Geosciences
104 Wilkinson Hall
Oregon State University
Corvallis, OR 97331-5506
Telephone: 541-737-8818
Email link
Joshua Murphy
NOAA Coastal Services Center
2234 South Hobson Avenue
Charleston, SC 29405-2413
843-740-1246
Email: Joshua.Murphy-at-noaa.gov
Lori Cary-Kothera
NOAA Coastal Services Center
2234 South Hobson Avenue
Charleston, SC 29405-2413
843-740-1243
Email: Lori.Cary-Kothera-at-noaa.gov