A Global Problem
The problem of invasive alien species (IASs) is a global one. It
appears as more nations develop and begin moving products and
people around the globe, more issues (and costs) arise due to
IASs causing ecosystem havoc and loss of biodiversity.
Fortunately, as more countries are forced to deal with the issue,
more people become aware of the problem and want to invest in a
solution. As this awareness has grown, so has the need to detect,
project, measure, and conceptualize the issue. GIS tools have
stepped into this role seamlessly. Research into the role GISs
play in the fight against IASs has come from around the globe. It
is my hope, through this annotated review of selected literature,
to get a grasp of how GISs are being utilized in this fight and
what the future may hold for this relatively new application.
|
Pino, Joan, et al.
“Invasibility of Four Plant Communities in the Llobregat
Delta (Catalonia, NE of Spain) in Relation to Their Historical
Stability.” Hydrobiologica. 570.1 (2006): 257 -
263.
The authors of this study wanted to find
a correlation between changes in the preservation of pristine
areas and the presence of invasive alien plant species. This
study, done on four separate plant communities within the
Llobregat delta in Catalonia, used GIS techniques to extract
“naturalness” data from orthophoto maps created in 1956
and 1999. Each photo was vectorized into land cover classes, then
combined to create a map of change-in-stability zones. This map
of “naturalness” was used to design a field sampling
plan within the four plant plots. Vegetation inventories were
taken according to community type and amount of stability.
Results displayed a relationship between invasibility and
stability-as stability decreased, invasibility increased.
Reedbeds and fixed dune communities seemed to show this trend the
most; indicating that as climax communities developed, alien
species were less likely to establish. However, the effect of the
relationship was dulled in the halophilic rushbeds and scrub
lands, most likely due to the environmentally stressful saline
habitat.
|
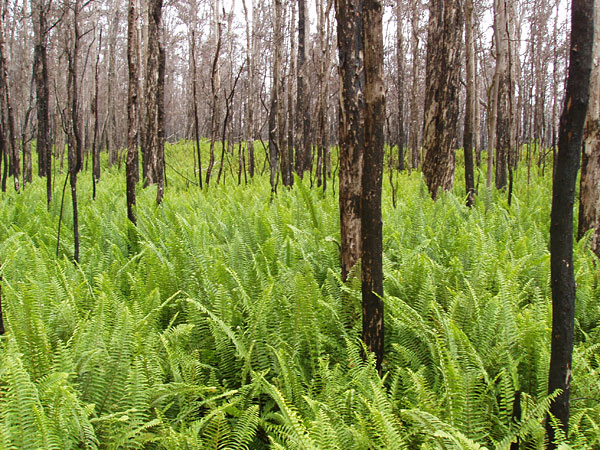
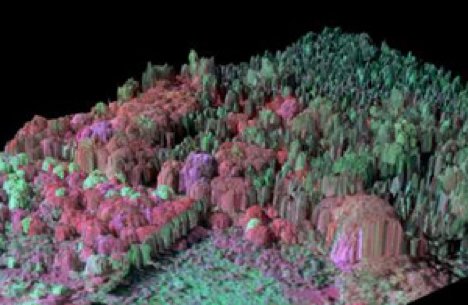
Rosso, P.H., et al.
“Use of LiDAR to Study Changes Associated With
Spartina Invasion in San Francisco Bay Marshes.”
Remote Sensing of Environment. 100 (2006): 295 -
306.
This study focused on the use of LiDAR
(Light Detection and Ranging) to detect the microtopography
created by invasive Spartina sp. The authors hoped to
better understand how these changes in topography may be
influencing the functioning salt marshes in the San Francisco
Bay, as well as be able to foretell and mitigate the changes
caused by these aggressive plants. They predicted that changes
could be measured within two years of initial invasion. Two tidal
salt marshes were chosen for the study and were both flown and
ground surveyed on the same day to minimize error for accuracy
testing. This study was designed to measure relative accuracies
within the LiDAR system. Tests were done on mean elevation and
scatter on each surface type at different azimuth angles, and how
inaccuracies between return order and different flight lines
effected the overall performance on different surface types.
Then, a second survey was flown a year later to test for
discrepancies between datasets. ArcGIS 8.3 was used to convert
LiDAR last-return point data into raster form to create a ground
model of possible topography changes. The resulting point data
indicated that first and last points had been inverted due to
vendor error, but regardless of this, point penetration to ground
was extremely low to none for vegetated areas. This suggested
LiDAR use in the creation of a “bare earth” model in
marsh areas may be compromised due to the extremely low, dense
vegetation. However, using variables correlated to vegetation
height seem to be a good alternative. Using this method the
authors observed a noticeable change in the erosion/sedimentation
patterns due to the rapid growth of Spartina sp. into
historically clear areas. Expansion was measured to be 2.5m/year
which will give future projects a tool in identifying the native
species from the invader.
|
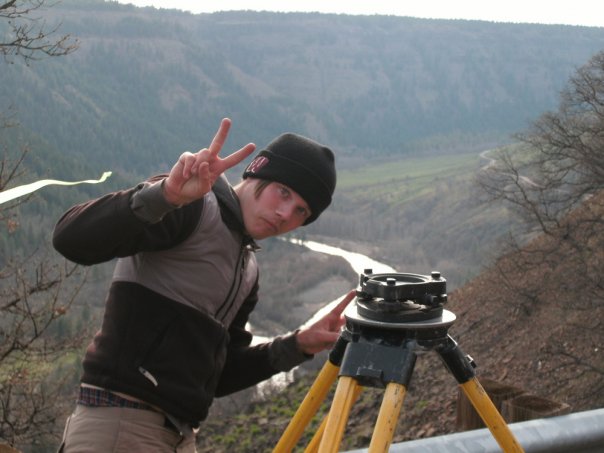
Dillemuth, Forrest P., et
al. “Patch Dynamics of a Native Grass in Relation to the
Spread of Invasive Smooth Brome (Bromus inermis).”
Biological Invasions. 11 (2008): 1381 - 1391.
The influence of IASs on native-plant
patch dynamics was the target of this study. With few studies
focusing on sub-meter native-invasive patch dynamics, the author
devised a six year study using GPS surveying techniques to tease
out the change in distribution patterns between invasive Smooth
Brome and native Prairie Cordgrass in three prairie fragments
near Grand Forks, North Dakota. Each patch was mapped three times
between 2000 and 2006. Attention was given to patches of Smooth
Brome and Prairie Cordgrass. Layers and subsequent buffers were
created in ArcMAP. From these datasets, patch area ratios and
rates of change dependent on corresponding species were
calculated and finally, extinction/establishment rates for the
native cordgrass were measured dependent on the influence of the
invasive brome. The authors found a strong relationship between
increases in Smooth Brome populations and the weakening of
Prairie Cordgrass patch dynamics. Not only were cordgrass patch
proportions falling, proportions of the brome were increasing
noticeably. However, it is noted that brome has not been shown to
completely terminate cordgrass patches, only weaken them. A
larger conclusion is made by the author indicating that invasive
species, as a whole, are capable of reducing abundances of native
species when native patches are invaded and have long lasting
effects on lower and higher trophic levels.
|
Chen, Hao, et al.
“Developing Habitat-suitability Maps of Invasive Ragweed
(Ambrosia artemisiifolia.L) in China Using GIS and
Statistical Methods.” GIS for Health and the
Environment: Development in the Asia-Pacific Regions. Berlin:
Springer, (2007): 105 - 121.
North American Ragweed is the IAS focused
on in this study, within an invaded area of China. The authors
proposed to create a prediction model of spatial distribution by
producing a habitat-suitability map from the native range and
projecting it onto the exotic (invaded) range using spatial
analysis and statistical GIS tools. As IASs become more severe in
China, an understanding of environment-species relationships
becomes more important. An ecological model, made up of
topological, climatic, and land cover data (from herbarium
specimen records), was designed to the requirements of Ragweed in
its native environment. This was done using a binomial logistic
regression and an Akaike’s information criterion (AIK) model.
From the resulting data a habitat-suitability map was created
through a reclass of the data and using ERDAS 8.6. The map was
then projected onto the exotic range (China) and predictions show
a strong possibility for extensive expansion. Each dataset was
shown to have a strong influence on ragweed distribution. The
studies results showed that there is a great potential for
Ragweed to move quickly to other regions of China not yet
effected by the invasion, which displayed how useful this
predictive model could be in other IAS situations through
international cooperation and data sharing.
|
Lavoie, Christian, et al.
“Geographic Tools for Eradication Programs of Insular
Non-native Mammals.” Biological Invasions. 9 (2007):
139 - 148.
The plight of island biodiversity due to
IASs, specifically from non-native mammels like goats, was the
backdrop for this study. Through the use of many GIS and GPS
tools, the authors devised several techniques in which to
anticipate, hunt, and monitor feral goats on Santiago Island,
Galapagos, as well as provide foundational methodologies for
future non-native mammal mitigation. SPOT images, in conjunction
with ArcGIS 8.1, was used in the planning, implementing, and
blocking of aerial and ground hunts, as well as for the Judas
Goat technique wherein a radio-collared goat is set free to lead
researchers to remaining colonies and allowing them to actively
monitor/anticipate movements. All movements, kills, and quadrants
are recorded using mobile GPS units, allowing projection of
concentrated and critical areas. The study showed that
visualizing and monitoring standard quadrants during hunting and
detecting was made more time and cost effective through the use
of GIS tools. Additionally, these tools allowed for a higher
success rate due to the detection of the last remaining
(sometimes hard to find) animals, and for statistics on success
and cost to be documented, visualized, and shared
easily.
|
Joshi, Chudamani, et al.
“Remote Sensing and GIS Applications for Mapping and Spatial
Modeling of Invasive Species.” Weed Technology. 23.1
(2009): 99 - 107.
In this research project, the authors of
this study sought to build a summary of different applications of
GIS and remote sensing (RS) within in the realm of invasive
species management (much like what I am seeking to build.)
Throughout the overview, the researchers were interested in what
methods were being used to predict distribution of IASs, what
kind of sensors and processing were used, whether or not any bias
of success toward any category of IASs has developed, how
reliable the products are, and can improvements be made. It was
suggested that studies are trending toward mapping IASs more
locally and with hyperspectral RS scanners with hieghtened pixel
size. The authors goes on to suggest that most successful RS was
had in the canopy category of species (i.e. top story species of
land cover) through canopy dominant species and their
interactions with natives and IASs. Less success is being had
with understory species and most animal invaders. In regards to
predicting potential areas of invasion, the authors found the
issue of ecological and biological complexity to be the biggest
hurdle. Because so many factors need to be quantified in dealing
with habitat and ecological relationships, RS and GIS models need
become far more sophisticated before real results are possible.
Finally, the author presses that advances in sensor technology
and the higher integration of RS and GIS into the wider realm of
IAS research will need to happen before progress can be
made.
|
Pande, Archana, et al.
“Using Map Algebra to Determine the Mesoscale Distribution
of Invasive Plants: the Case of Celastrus orbiculatus in
Southern Illinois, USA.” Biological Invasions. 9.4
(2007): 419 - 431.
Using observations from modeling and
predicting the presence and absence of Celastrus
orbiculatus, the authors of this study hoped to find a good
GIS tool for mapping distribution of invasive plants. Landscape
characteristics (solar radiation, elevation, distance to roads,
etc.) were identified as the basis of invasion dynamics, and they
propose the use of “map algebra” (using raster cell
values to represent data from numerous other data fields), in the
form of raster logistic regression, as a way of accurately
processing predictive data on a given IAS of plant. Predicting
the presence (88.3%) and absence (85.5%) of C. orbiculatus
was relatively successful with elevation and slope representing
the highest influencing factors on predictability (but not
necessarily directly influencing the species themselves). Through
their results, the authors suggest the map algebra model as a
highly predictive tool in the management of invasive plants as
long as the dynamics of dispersion are understood, the field
samples are representative of the species population, and the
relationship between species and landscape factors are correctly
modeled.
|
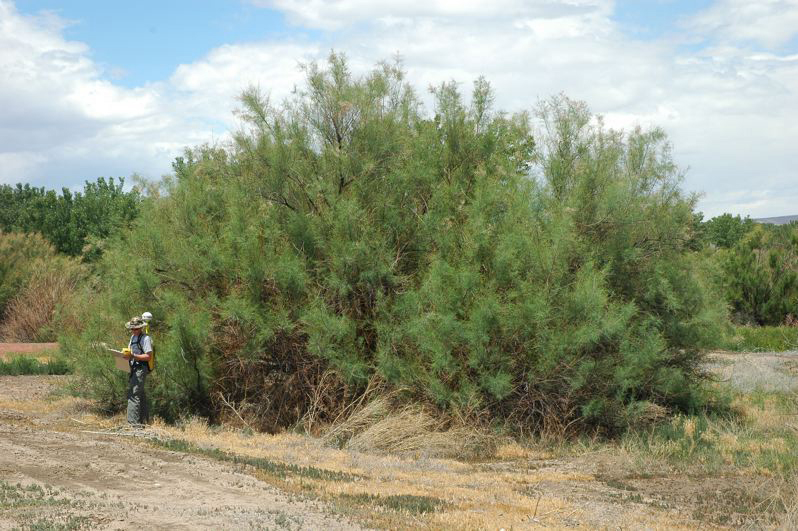
Evangelista, Paul H., et
al. “Mapping Invasive Tamarisk (Tamarix): A Comparison of
Single-Scene and Time-Series Analyses of Remotely Sensed
Data.” Remote Sensing. 1 (2009): 519 -
533.
A comparison of of methods used in
detecting Tamarisk from remotely sensed (RS) data is what the
authors of this study propose. Tamarisk, being a very hearty
invader of the SW United States, can be difficult to accurately
detect through RS in the past. However, the researchers consider
the use of better sensors and more advanced software models in an
attempt to find the best use of the maximum entropy model with RS
data derived from several points in the growing season and using
both single-scene and time-series analysis. Using Landsat 7
satellite imagery from six times within the growing season, data
was collected in both the visible and near-infrared (NIR)
spectrums. It was concluded that the time-series analysis using
72 variables was the best method with 96% accuracy in
presence/absence predictions. Generally, the best time for
collection accuracy was the late season data sets that had less
interference from native plants due to dormancy and early season
datasets that were aligned with flowering. The authors conclude
that with the right corrections in variables, this model, taking
advantage of maximum entropy, could be used toward detecting many
other IASs.
|
Underwood, Emma C., et al.
“A Comparison of Spatial and Spectral Image Resolution for
Mapping Invasive Plants in Coastal California.”
Environmental Management. 39.1 (2007): 63 - 83.
The researchers in this study wanted to
compare the different detection accuracies and efficiencies of
high versus low spectral and spatial resolutions in sensing three
invasive plants (Carpobrotus edulis, Cortaderia jubata, and
Eucalyptus globulus) in California. Using AVIRIS imagery, four
categories were used in sensing areas around Vandenburg Air Force
Base: hyperspectral high resolution, hyperspectral low
resolution, degraded spectral high resolution, and degraded
spectral low resolution. Overall, the most accurate category for
detecting was the hyperspectral high resolution at 75%, followed
by hyperspectral low resolution at 58%. Detection peak accuracy
for the three species was 97%, 82%, and 68% for E. globulus, C.
Jubata, and C. Edulis respectively. It was interpreted that
species invading areas of low biodiversity could be more
accurately detected using lower resolution spatial sensors (30m);
compared to areas of high biodiversity where spatial resolution
needed to be higher (4m) in order to measure at an acceptable
accuracy. Overall though, spectral resolution was found to be of
greater influence to accuracy than variance in spatial
resolution.
|
Rew, Lisa J., et al.
“Searching for a Needle in a Haystack: Evaluating Survey
Methods for Non-indigenous Plant Species.” Biological
Invasions. 8 (2006): 523 - 539.
In trying to find the best surveying
technique for bio-inventory studies focused on non-indigenous
plants, the authors of this study concentrate on seven different
ground survey styles to compare and contrast their abilities to
detect accurately and efficiently (in terms of time and distance
covered) using ArcView 3.2. A 10 X 10 km section of Yellowstone
National Park was selected for the study. The seven
studies—one biased (termed “seek and destroy”),
one unbiased systematic, two unbiased totally random, and three
unbiased random stratified along rights of way (RoW.) Analysis
showed a significant advantage to the point measurement using
systematic (grid) alignment and random alignment in intersecting
more patches of non-indigenous plants when considering both
random and weight (distance to RoW) distributions. However, in
relation to time and resource efficiency, a biased Search and
Destroy method of detection may be the best; although it may be
the worst in terms of understanding area distribution due to the
obvious bias.
|