Table of Contents:
1. Annotated
Articles
2. Other Articles
3. Explore Further
4. Books
Shinjy Shabuya
The author currently works in the semiconductor industry on embedded GIS products.
Interests: Using GIS tools for spatial disease mapping, GIS ethics, and GIS tools for image processing.
AvRuskin, Gillian A., Geoffrey M. Jacquez, et al. Visualization and exploratory analysis of epidemiologic data using a novel space time information system. International Journal of Health Geographics, V3 N26: (2004).
The authors present a Space Time Information System that integrates temporal data manipulation and analysis capabilities within a GIS. They present the first use of this system to study bladder cancer and arsenic exposure and point out that modeling temporally will be crucial to monitoring diseases with long latency periods. Their main idea stresses that the "what and where" of a standard GIS should be extended to "what, where, and when". They describe how a space-time coordinate is integrated within the system along with standard GIS variables: latitude, longitude, etc., and emphasize a new variable, or movement model, that can describe how objects move as a function of time. Their study focus is on where people have lived during prolonged periods in life and how their system integrates the "when" into GIS based disease studies.
Busgeeth, Karishma, and Ulrike Rivett. The use of a spatial information system in the management of HIV/AIDS in South Africa. International Journal of Health Geographics, V3 N13: (2004).
This paper outlines a system (SIMS) to store, track, and display spatial information on the HIV epidemic within a small township in South Africa. The system is part of a pilot study that could be extended to all of the country bringing together standard GIS data on location, with specific HIV treatment data for each individual. SIMS allows one to more easily see the distribution of disease within the community and identify "hot" areas where health officials need to some take prompt corrective action. If SIMS were extended to cover the entire country it would be useful to couple it with other spatial disease databases currently in existence, those for Malaria and Tuberculosis for example. The authors point out that complete medical records for each patient would greatly enhance the decision making value of this system. Pulling all of this together raises the question of GIS data privacy, particularly important where HIV is concerned. Microsoft Access and ESRI were used as tools.
Furlanello,
C., Markus Neteler, et al.
GIS and the Random Forest Predictor:
Integration in R for Tick-Borne Disease Risk Assessment.
Vienna, Austria: DSC-2003, March 20-22.
http://www.ci.tuwien.ac.at/Conferences/DSC-2003/Drafts.
Here the authors describe a general procedure for using open source GIS tools (GRASS-R-PostreSQL) to do environmental disease modeling. The emphasis is on using GIS to predict suitable conditions that may lead to a tick borne epidemic (Lyme disease), or any environmental vector caused epidemic in general. The study highlights Forest Ticks in the Italian Alps. One of the authors is a proponent of GRASS and co-author of the GRASS textbook (Neteler and Mitasova 2002 and 2004). They describe in detail the use of open source tools, GRASS, R (R package randomForest), and PostreSQL, to do the field risk mapping, highlighting the use of the software tools to make a community health contribution. If one wants to know how to begin using open source tools for disease mapping and assessment this paper is a good place to begin.
Isorna,
Carlos et al.
GRASSlicer: A Medical Image Analysis
and Visualization Tool.
Proceedings of the FOSS/GRASS Users Conference 2004.
Bangkok, Thailand: September 12-14 (2004).
http://gisws.media.osaka-cu.ac.jp/grass04/papers.php?first_letter=all.
Isorna's group in Spain investigated the use of GRASS for general medical image processing applications. They first examined those GRASS raster image processing routines useful for the traditional medical image processing pathway: enhancement, segmentation, and registration. The team wrote a TCL binding for GRASS and used TK for a user interface GUI. The TK interface allows users to call the GRASS image processing routines directly, bypassing the GRASS interface. They conclude that image processing is often independent of the field studied and that the GRASS algorithms are useful for a wide variety of applications, not only GIS. This author obtained the GRASSlicer source code from Isorna's group and installed it. It works well but until specific medical imaging routines are added, volume rendering in particular, it will be of limited use. For comparison purposes, Harvard University released a dedicated system called 3D Slicer but development seems to have stopped on that project. There is potential in the GRASS-R-PostgreSQL tool chain for general health related image processing applications. Some type of universal GUI front end such as Qgis would speed user acceptance of open source medical imaging applications based upon GIS tools.
Krivoruchko, K, and
C.A. Gotway.
Creating Exposure Maps Using Kriging.
Public Health GIS and Information, published by the CDC, N56: 11-16 January
(2004).
http://www.cdc.gov/nchs/data/gis/cdcgis56.pdf
and http://www.esri.com/news/arcnews/fall03articles/analyzing.
There are actually two papers here that deal with similar themes with an identical coauthor. Creating Exposure Maps focuses on Kriging: its origins, its different types, underlying assumptions about the data in order to use it correctly, and the output maps generated as a result. Three different types of Kriging, simple, ordinary, and universal are explained along with the input data conditions that indicate which of the three models would be appropriate for use, along with the output semivariogram. Further kriging subtypes are also briefly explained: indicator kriging uses binary threshold variables then applies ordinary kriging to make predictions, disjunctive kriging assumes all data come from a bivariate normal distribution - the payoff is that this can be used as an alternative to indicator kriging under certain circumstances, finally cokriging is used when combining spatial data variables to create a single map. Four (4) types of output maps are described: prediction maps, standard error maps, probability maps, and quantile maps and how each is produced from input spatial data. A point is made that, unlike data smoothing techniques, interpolated kriging maps will pass through each of the original spatial data values. As case study is presented on food contamination and disease rates resulting from the Chernobyl nuclear power plant disaster. A database of Cesium-137 contamination of food was used to create radiation exposure maps for soil(mushrooms) and milk.
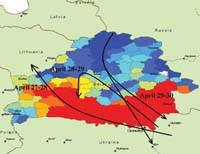
The 2nd paper applies the same techniques to case studies of radioactive rain in Sweden, Thyroid Cancer rates in Belarussian Children, and the food contamination study described in the first paper (all resulting from the Chernobyl disaster). This 2nd paper was apparently written to illustrate the capabilities of ESRI software. This author wrote Dr. Krivoruchko to request the data sets for analysis using other spatial statistics software, he replied that the data was unavailable.
Malone,
JB, JC McCarroll, et al.,
Minimum Medical Database Spatial
Decision Support System for the Nile Basin Region (IGAD-NILE).
The Rockefeller Foundation Bellagio Fund and National Institutes of Health,
Grant No. 1RO3 AI 42077.
Minimum Medical GIS Database IGAD Version 1.0 (2001).
http://www.GnosisGis.org.
This paper describes the data (and CDROM) used to support a GIS analysis system for East Africa used in the tracking of snail borne infections with an emphasis on Schistosomiasis. It describes in some detail all of the various individuals and agencies involved (six pages of introduction). This data is not free though most of it was gleaned from public sources. Note also that there is a similar database available for Asia called the Asia MMDB (China centric) from the same organization (also not free). The database contains geographical and environmental information that may be used to construct epidemiological "what if" scenarios for East Africa, in particular (Kenya, Uganda, and Ethiopia). The main raw data sources are from: various US government agencies, the WHO, and the LSU school of Veterinary Science. This database is a good example of GIS data assembled for public health use by an organization and offered for sale. The software target for the Africa MMDB and the Asia MMDB are the ESRI tools. This author wrote one of the paper authors in October 2004 requesting additional information on both databases - thus far no reply.
Peng, RD.,
LJ Welty, LJ., and A. McDermott.
The National Morbidity, Mortality,
and Air Pollution Study Database in R.
Johns Hopkins University, Dept. of Biostatistics Working Papers - Johns
Hopkins University, (2004),
http://www.biostat.jhsph.edu/research/publication/articles.shtml#Peng.
This is an extensive description of US air pollution mortality and morbidity data for the period of 1987-2000. The emphasis is on using R (an open source statistical package similar to Splus - see http://www.r-project.org) to analyze the data and reproduce existing results. This data set is large, containing air pollution data for 108 US cities. The authors provide an overview of the data and describe in detail how to load this data set into R and build a database for processing. There is an R package written especially for processing this data set which contains 18 functions (see R package NMMAPSdata on the R web site). The authors then demonstrate a morbidity model using time series techniques. More advanced modeling techniques which include seasonal and temperature data are also described, along with the R code to do the analysis. The epidemiologists are continuously looking at new models to describe disease and disease clusters spatially. This is a primary reason why they like working with Splus, R, and other statistical packages; it's easy to experiment with new algorithms and benchmark them, features the commercial GISs do not offer. The drawback here is that the city data cannot be readily displayed within any GIS (at this time). R has some packages for reproducing maps (mapdata, maps, mapproj, and maptools) that may be used with this data set, but they are not as useful as those found within a GIS.
Rytkonen,
Mika JP.
Not All Maps Are Equal: GIS and
Spatial Analysis in Epidemiology.
International Journal of Circumpolar Health, V63 N1: 9-24 (2004).
The objective of this paper is to look at GIS use within epidemiology, specifically spatial analysis methods and the unique opportunities offered within circumpolar countries. Until recently, as the author points out, GIS has been used primarily for map making within the public health and epidemiology community. Whether GIS can be successfully linked to epidemiology depends strongly on the data available for analysis and spatial analysis techniques (algorithms) used for processing the data. The author advocates more emphasis on GIS gleaned knowledge, than on a more traditional GIS approach (database, information processor, map maker). The epidemiologists too have differing spatial analysis needs than the traditional GIS community: the scale may be micro or macro, GPS may be used to fix point data, methods assigning people to place can be inadequate, and Bayesian statistics are often preferred for modeling purposes over standard descriptive statistics. If the spatial component within health studies is not clearly defined and understood, GIS techniques, if poorly applied can do more harm than good.
Tanser, Frank C.,
and David le Sueur.
The application of geographical
information systems to important public health problems of Africa.
International Journal of Health Geographics, V1 N4: (2002).
This article surveys the use of GIS in Africa for health purposes and makes the point that GI Science is much more relevant than any underlying technology there. The authors assert that in Africa, health is determined by environmental factors (physical and sociocultural) more so than in other places and that there is a bias towards environmentally based disease. To illustrate this they describe the spatial link of the primary diseases in Africa: climate to Malaria (varies with location) and social/cultural forces to HIV and Tuberculosis (varies with location). Though HIV is the leading cause of death in Africa, Tuberculosis kills more worldwide than than Malaria, Diarrhoea, HIV, and other tropical diseases. In order for GI Science to be successful in Africa a number of internal obstacles must be overcome: lack of trained staff, most GIS are studies with few operational systems, lack of suitable datasets, minimal cooperation amongst the stakeholders, and that most GIS/health studies are controlled by outsiders and not the Africans themselves. Of the GIS studies in Africa, most of the effort has gone into Malaria, followed by Tuberculosis (South Africa), with HIV recording only one GIS study at the time of writing.
Waters,
Nigel.
GIS and Ethics: Reloaded.
GIS @ Development, V8, N7: (2004).
http://www.gisdevelopment.net/magazine/years/2004/july.
Waters questions the current lack of GIS ethics and stresses the need for some type of professional code of ethics. He takes aim at ESRI in particular for not promoting an ethical code within the GIS community. Typing the word "ethics" into the ESRI search engine yields no results, while typing the word "privacy" lets one know what ESRI may do with web site visitors (or customer) information. A case of "do as I say but not as I do" in Waters opinion. Waters also questions the the use and abuse of GIS information which has increased unauthorized use of personal information and may easily lead to privacy violations for all of us. The GIS software world has contracted greatly over the past two decades, resulting in mergers and many company closures. The result is a concentration of market power in a few commercial GIS vendors hands. He questions the non-benchmarking of GIS software, spatial packages, and algorithms and points out that other software rightly undergoes transparent and public benchmarking. Why not GIS? The roles of governments, GIS academics, and GIS consultants are also reviewed through the lens of privacy. Since most geographic information within a GIS is public, he asks why it is so expensive and difficult to obtain - and also why commercial GIS software is prohibitively priced for users in developing or 3rd world countries. Academics and consultants, (the implication is North America) are further signaled out for being beholden to the commercial GIS industry, and for not being critical of their practices. Finally the misuse of public GIS information by governments is pointed out, along with the lack of citizen participation when using the information. This is an excellent article with a decent bibliography of its own.
World Health
Organization.
Weekly Epidemiological Record - Mapping for Epidemiological Surveillance.
World Health Organization, Geneva, N34: 281-285, 27 August (1999).
http://www.who.int/wer.
This paper, part of a series published by the WHO, introduces the reader to the possibilities of GIS within the public health community. It begins with the now standard definition of a modern day GIS (for the uninitiated) and goes on to describe how a GIS may be used in epidemiological settings: for data collection, management, and analysis and which questions a GIS can assist in answering for those interested in disease mapping. The paper describes in general how one would apply a GIS in particular for epidemiological surveillance. Two brief examples from Africa are noted in the paper. For those seeking an introduction to the disease mapping possibilities of GIS this paper is a good place to begin.
World Health
Organization.
Public Health Mapping - Data
Management and Mapping for Public Health.
World Health Organization, Geneva: (2003).
http://www.who.int/csr/mapping/en.
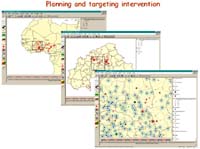
The WHO Health Mapper is a suite of software programs designed to simplify the collection, storage, use, and management of public health information. The paper goes on to describe the standard GIS components and how they are used within the Health Mapper. The WHO site describes both products and services available for users who adopt the system. It is unclear whether these products and services are fee based or not. The author wrote the WHO in early October 2004 requesting additional information on the system, specifically whether the software and data are available to the general public - no reply has been received thus far. Case studies in the use of the Health Mapper for disease surveillance are presented: Malaria in Africa, analysis of safe water supplies, and comparisons of temporal environmental health data over time. The central idea is how the Health Mapper can assist government agencies, and NGO's with planning and effective responses to critical health events, be they some type of epidemic or environmental conditions that may facilitate an epidemic (Cholera and Malaria for example). The site also stresses that the Health Mapper is targeted towards those regions of the world that typically do not have ready access to health based GIS tools.
Useful articles not annotated here:
- http://sal.agecon.uiuc.edu/courses/sa/index.html. Luc Anselin's Spatial Analysis course at the UIUC spatial analysis laboratory. Covers the basics using GeoDa and the ESRI tools. GeoDa is an analysis tool developed at this laboratory for spatial data exploration and analysis; it also has mapping capabilities.
- http://www.postgis.org - PostGIS is an addition to the industrial strength PostgreSQL (http://www.postgresql.org) database that allows for storage and query of geographical information, typically in vector format. Accessed September-November 2004 from the WWW.
- http://www.geog.uni-hannover.de/grass - The homepage of GRASS, an open source GIS documented in Neteler and Mitasova's book. Grass does not have a WYSIWYG GUI as it was born during the UNIX days prior to X-Windows. It's really a shell script that sets up a command line environment so that GRASS commands may be called easily. There are interfaces for the R and PostgreSQL packages. Data from GRASS may easily be read in and processed using R; it's not easy to get the R processed data back into GRASS for map display or 3-D visualization currently (though R can display excellent statistical maps). In terms of productivity if one is comfortable with the shell GRASS is great, if not look for a GUI based GIS. Cost and licensing issues are additional concerns with any commercial GIS.
- http://qgis.sourceforge.net - The authors claim that QGIS will be a full fledged open source GIS in its own right. However they also acknowledge that there is no need to reinvent the wheel. Currently it has the capability to read (using GDAL) and display a variety of raster and vector formats. I see its future as a decent GUI for GRASS. Accessed September-November 2004 from the WWW.
- http://www.r-project.org - An open source statistical modeling software system which is extremely powerful. Many add on packages contributed by users and researchers are available. R is mostly compatible with Splus. Much of the current spatial epidemiology research uses R or Splus as a base system for algorithm development.
- http://www.cdc.gov/nchs/about/otheract/gis/gis_publichealthinfo - A repository for health and epidemiology GIS issues on the internet. The monthly Public Health GIS News and Information is a good source of up to date information, including links to relevant web sites and paper abstracts. Past issues are online for easy review.
- http://zappa.nku.edu/~longa/geomed - A good introduction to spatial epidemiology and public health. This is a U. Michigan course with online modules and labs that demonstrate spatial analysis techniques used in public health. The site also has a detailed reading list.
- http://gis.cancer.gov - The National Cancer Institute GIS site. Government centric epidemic, public health, and GIS tool information related to cancer within the US. The spatial data analysis link is a good place to begin when investigating what can be done using GIS. This site has a wealth of information which is indexed fairly well.
Ash, Carol.
The Probability Tutoring Book - An Intuitive Course for Engineers and
Scientists (and everyone else!).
New York: IEEE Press, (1993).
Cember, Herman.
Introduction To Health Physics, 3rd ed.
San Francisco: McGraw-Hill, (1997).
Crawley, Michael J.
Statistical Computing - An Introduction to Data Analysis using S-Plus.
West Sussex UK.: Wiley, (2002).
Gonzalez, Rafael C., and Richard E. Woods.
Digital Image Processing.
Upper Saddle River, NJ.: Pearson/Prentice Hall, (2002).
Gonzalez, Rafael C., Richard E. Woods, and Steven L. Eddins.
Digital Image Processing Using MATLAB.
Upper Saddle River, NJ.: Pearson/Prentice Hall, (2004).
Lathi, B.
P.
Linear Systems and Signals.
Oxford UK.: Oxford, (2004).
Lillesand, Thomas M., Ralph W. Kiefer, and Jonathan W. Chipman.
Remote Sensing and Image Interpretation, 5th ed.
New York NY.: Wiley, (2004).
Longley, Paul A., et al.
Geographic Information Systems and Science.
New York NY.: Wiley, (2002).
McAndrew, Alasdair.
Introduction to Digital Image Processing.
Australia: Thomson, (2004).
Neteler, Markus, and Helen Mitasova.
Open Source GIS A Grass GIS Approach.
Dordrect, Germany: Kluwer Acedemic Publishers, (2004).
Venables, W.N., and B.D. Riplay.
Modern Applied Statistics with S, 4th ed.
Germany: Springer, (2002).
Yates, Roy D. and David J. Goodman.
Probability and Stochastic Processes, 2nd ed.
New York NY.: Wiley, (2004).
Zar, Jerrold H.
Biostatistical Analysis, 4th
ed.
Saddle River NJ.: Prentice Hall, (1999) .