Dr. Dawn Wright, Oregon State
University
National Geographic/NOAA
Classroom Exploration of the Oceans Virtual Teacher & Educator Workshop,
July 28-August 1, 2003
Exploring the Twilight Zone...
of American Samoa
CEO
Keynote, July 28, 2003
Aloha! Talofa! Greetings! During this extensive
Classroom Exploration of the Oceans, you've no doubt learned quite a bit about coral
reef ecology, as well as the challenges and practices of coral reef
conservation and management. And I understand that there is more great
information to come. During this keynote, I'm pleased to share some
information about 2 critical mapping technologies that support coral reef
conservation and management: multibeam surveying to derive the bathymetry
(i.e., submarine topography) of coral reef environments, and geographic
information systems (GISs) that can be used to map and integrate bathymetry
with many other kinds of scientific and resource management data for the
purposes of improved data interpretation, and managerial decision making.
You've had a great introduction to multibeam mapping from Dr. Margo Edwards, but I'll
spend some time briefly reviewing some additional basics, introducing the
basics of GIS, and then sharing some preliminary results from recent
shallow-water multibeam bathymetric surveys and GIS work conducted in 2001 and
2002 to support of the Fagatele (FOHNG-ah-tehleh) Bay National Marine
Sanctuary in American Samoa.
Quick Reference
Introduction
Initial Bathymetric Mapping and a FBNMS GIS
Pacific Islands GIS
Sustainable Seas Expeditions Mission
Ongoing Initiatives
Conclusion
Acknowledgements
References
Panoramic digital
photo mosaic showing Tutuila, American Samoa in the distance.
Photos taken at sea aboard the R/V Roger Revelle by Stassia Samuels, National Park
of American Samoa, March 2002
Introduction
As you may already
know, there are currently thirteen sites in the U.S. National Marine Sanctuary
System that protect over 18,000 square miles of American coastal waters. Coral
reefs are a particular concern at several of these sites, as reefs are now
recognized as being among the most diverse and valuable ecosystems on earth, as
well as the most endangered. In the southwestern Pacific lies the small
archipelago of American Samoa. As opposed to the independent nation of Samoa
directly to the west, it is the only U.S. territory south of the equator and is composed of five volcanic islands (from west to east:
Tutuila, Anunu, Ofu, Olosega, and Ta'u), two small coral atolls, (Rose and
Swain islands), and a recently-discovered submerged volcano named Vailulu'u
(Hart et al., 2000). The total area of these islands is roughly 76 sq. mi.
(about the size of Washington, DC) and has a population (except for Vailulu'u
of course!) of approximately 64,000 people. Tutuila is 54 sq. mi. in area and
contains over 90% of the territory's population.
American Samoa lies approximately 1000 miles south of the equator, over 2200 miles from Honolulu, 4525 miles from Tokyo, and 2700 miles from Sydney (map courtesy of the National Park of American Samoa).
The islands of Western and American Samoa, presumed recently by scientists to have formed as the overlying crustal plate moved over a stationary "hotspot" in the Earlth's mantle (very similar to the formation of the Hawaiian islands; graphic by Jayne Doucette, Currents Magazine, Woods Hole Oceanographic Institution).
American Samoa is
home to many natural treasures, among them the Fagatele Bay National Marine Sanctuary
(FBNMS), the smallest, remotest, and least explored of the 13 sites within the
U.S. National Marine Sanctuary System, and the only true tropical coral reef
among the thirteen sites. The FBNMS is located at the
southwest corner of the island of Tutuila. The bay is an ancient flooded
volcano, with a thriving coral and calcareous algal reef community that is
rapidly recovering from an infestation of crown-of-thorns starfish that
devastated the corals in the late 1970s, as well as the effects of 2 hurricanes
in the early 1990s (Birkeland, et. al., 1987). Although much of the coral cover
has been destroyed, fish populations still thrive, particularly surgeonfish,
damselfish and angelfish (Craig, 1998; Akins, 1999). In addition, the steep
slopes surrounding the bay contain some of the rarest paleo-tropical
rainforests in the U.S. (http://www.fbnms.nos.noaa.gov). One of the greatest
threats currently facing Fagatele Bay, as well as much of Samoa's coastal
waters, is the rapid depletion of fish stocks by the illegal use of gill netting,
spearfishing, poison and dynamite (Sauafea, 2002). In addition, the sanctuary
staff is concerned about the potential for algal blooms with subsequent
incidents of hypoxia (extremely low dissolved oxygen in the water) due to
unchecked sewage outflow "upstream" from the bay.
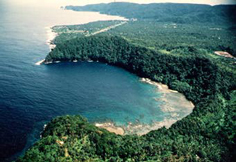
Fagatele Bay, in the SW corner of Tutuila, American Samoa, was designated as a national marine sanctuary on April 29, 1986.
Various agencies
within the territory are responsible for coastal and ocean resource management,
community-based wetlands management, land use permitting, coral reef protection
and monitoring, and public outreach and education. Chief among various pressing
environmental issues are overfishing, declining coastal water quality, oil
spills and oil pollution (especially with the heavy traffic of commercial
fishing vessels), mangrove habitat degradation, and assessment of fisheries
stocks, and threats to coral reef ecosystems due to non-point source pollution,
hurricanes, and crown-of-thorns starfish invasions. More information may be
found at the American Samoa Goverment's Department of Commerce Environment
Division web site, www.amsamoa.com/czm.htm.
Initial Bathymetric Mapping
and a FBNMS GIS
In late 1990s NOAA
launched a major intiative to explore, document, and provide critical
scientific data for the National Marine Sanctuary System, with the goal of
developing a strategy for the restoration and conservation of the nation's
marine resources. One of the major catalysts behind this effort was the
5-year Sustainable Seas Expeditions (SSE; sustainableseas.noaa.gov),
led by famed marine biologist and National Geographic Explorer-in- Residence
Dr. Sylvia Earle and former National Marine Sanctuary program director
Francesca Cava. SSE used new technologies, including their 1-personed
submersible DeepWorker, to
pioneer the first explorations of the sanctuaries.
Logistics and scheduling prevented a visit
to the FBNMS by a NOAA research vessel with the DeepWorker submersible, but, as
an SSE collaborator, I teamed with FBNMS manager Nancy Daschbach, and University
of South Florida (USF) scientists David Naar and Brian Donahue, to undertake
successful bathymetric surveys and the initiation of a FBNMS GIS in April and
May of 2001. Until recently the sanctuary, as well as the national park were
largely unexplored below depths of ~30 m (on into the twilight zone of ocean depths where light begins to fade, and deeper, with no prior bathymetric base map in
existence and no comprehensive documentation of undersea flora, fauna, and
habitat. The team used a Kongsberg-Simrad EM 3000 portable multibeam
bathymetric mapping system, attached to the bow of a 30-foot survey boat loaned
by the Department of Marine & Wildlife Resources (DMWR) of the America
Samoa Government. Before providing further details, lets jump into a basic
review of technologies.
A "Crash
Course" in Ocean Floor Mapping and GIS!
You know now from Dr. Margo Edwards keynote that we
have made more progress mapping the neighboring planets than we have our own
"seven seas! Indeed, we know more about the dark side of the moon and the
topography of Venus and Mars than we do of our ocean floors (or "seafloor"
or "seabed"). When NASA announced that its high-profile Shuttle Ray
Topography Mission had mapped eighty percent of the earth's surface, they
neglected to mention that they had skipped the parts that are underwater (71%
percent of the globe's actual surface area) which remained impervious to the
Shuttle's spectacular remote sensors.
When viewed from space, the Earth appears
strikingly as a planet of water, with 71% of it surface covered by a fluid
envelope averaging 5000 m in depth. This envelope is a vast inner space, which,
along with the underlying ocean floor, is still only dimly perceived by humans.
What can be perceived of the water column and ocean floor must be done mostly
with the aid of sound, as sound waves are transmitted both farther and faster
through seawater than electromagnetic energy. In order to "see" the
ocean floor for instance, sound is essential not only for determining depth to
the bottom, but for detecting varying properties of the bottom. In a typical
multibeam bathymetric mapping system, multiple pulses of sound are
released and form beams on their way down to the ocean floor. The sound
reflects back after striking an object on the ocean floor Depths are commonly
measured by timing the two-way travel time of a sound pulse from ocean bottom
back to the ship. As the speed of sound in seawater varies linearly with
temperature, pressure, and salinity, the conversion of travel time to depth
must take this into account. In addition, the intensity of this reflection, or
backscatter, can be used to resolve the shapes of objects or the character of
the bottom (e.g., heavily sedimented and thus non-reflective or glassy with
fresh lava flows and thus extremely reflective).
A typical multibeam bathymetric system operating from the hull of a large (200-300 ft.-long) deepsea research vessesll (graphic courtesy of NOAA). In this picture, a multibeam system is mounted on a vehicel being towed behind the ship as well. Acoustic pulses are sent out in "swaths" - "mowing the lawn" with these swaths usually results in near complete coverage of the ocean floor below. The system used in American Samoa was a portable instrument mounted on the bow of a small, 30-ft., survey boat.
The resulting maps from this system are
perfect fodder for GIS, both for display and interpretation of bathymetric data
sets but also for integration, comparison, and analysis with other
kinds of data (biological data on coral reef species, temperature and chemistry
of the water column above the ocean floor, and data on bottom currents, as well
as boundaries delineating sanctuary limits, no-take zones, etc.; Figure 6). The
high cost of acquiring these data often singularly justifies the development of
dedicated GISs for the integration of these data. And by using GIS, the synergy
of different types of data provides oceanographers with more information and
insight than could be obtained by considering each type of data separately.
Three-dimensional visualization of the ocean floor and accompanying shoreline and mountains along N. California, created with a scientific visualization package and a GIS by Dr. Larry Mayer and colleagues at the U. of New Hampshire's Center for Coastal and Ocean Mapping.
So what is GIS? A GIS is basically a computerized mapping and
database system that helps to integrate and analyze data of various types. With
GIS, not only do you have the map itself, you also have important information
about the features on the map. GIS maps are thus often referred to now as
"smart" maps because you have a whole database of information and a
powerful suite and statistical and mathematical analysis tools
"magically" connected to the points, lines, areas, and surfaces that
you would normally see on a paper map. The data in GIS are like layers in a
sandwich, except that the layers represent information about a
geographical place to give you a better understanding of that place. The
"meat", for instance, might be the ocean floor; the lettuce, the types
and properties of various kinds of corals; the cheese, the temperature or
salinity of the water, etc.. We can keep adding layers to the system such as
directions of bottom currents, or locations of shipwrecks. And we may see
changes in these layers through time. GIS was first heavily used by scientists
in the forestry, civil engineering, and conservation biology communities for
various terrestrial applications. It is now beginning to make a quite a splash
in the field of oceanography as well. The integration of multidisciplinary data
gathered from many different kinds of vehicles or instruments is of great
importance in oceanography, where geologists, chemists, biologists and
physicists must often work together in order to understand the "big picture"
of ocean processes.
GIS, the key to data integration, analysis, and understanding (graphic courtesy of ESRI).
As agencies and institutes such as the
National Oceanic and Atmospheric Administration (NOAA) National Marine
Sanctuary Program and National Ocean Service, the U.S. Geological Survey
(USGS), and the Monterey Bay Aquarium Research Institute adopt GIS, its
becoming clear that not only are the needs of basic science and exploration
being served, but those of ocean protection, preservation, and management as
well. Exponential improvements in the speed and capacities of computer hard-
and software, an accompanying drop in prices, and the increased availability of
skilled practitioners in GIS are making implementation possible where costs
have been, until very recently, prohibitive. Data, too, is easier to obtain via
the Internet, the World Wide Web, and numerous public sources of spatial
information, such as the National Geophysical Data Center, the NASA-funded
Distributed Oceanographic Data System (DODS), the EarthExplorer of the USGS,
and the Federal Geographic Data Committee's National Geospatial Data
Clearinghouse. I'd be happy to provide links and explanations for these
sources during our discussion. And
finally, although the realization of true 3-dimensionality remains a challenge
(particularly in the marine/coastal realm where there are dissimilarities
between the horizontal and vertical dimensions), the mapping of our oceans
continues to be an area of research that pushes the boundaries of a new field
called geographic information science, compelling significant attention from funding agencies such as the
National Science Foundation and the NOAA Office of High Performance Computing
and Communications.
There are many additional sites that I can
point you to regarding ocean floor mapping and GIS, but for now you may really
enjoy an excellent piece written by Dr. Robert Aguirre for NOAA's new Ocean
Exploration site:
NOAA
Marine GIS Overview
Also: The "Pirates' Pick
of Seafloor Mapping and GIS Links from Davey Jones' Locker
Two recent books on these subjects are:
Marine and Coastal Geographical
Information Systems
Undersea with GIS, from
which a good portion of this keynote has been drawn.
Back to American
Samoa: Coral Reefs... and Shipwrecks Too!
And now I'd like to return our discussion
to our survey sites in American Samoa. So In 2 weeks of surveying, full
bathymetric coverage was obtained around selected sites off the main island of
Tutuila, American Samoa: the FBNMS in the southwest, part of the National Park
along the north shore, Pago Pago harbor and Taema Bank to the south, and
Faga'itua Bay in the southeast . Post-processing steps after the surveys were completed included the
"cleaning" of the navigation to delete erroneous positions, then
tidal corrections were applied to the depth soundings using NOAA, verified
downloaded tide data available for the study area. ASCII formatted x-y-z depth
data were then gridded using MB-System, a public-domain suite of software tools
for processing and display of swath sonar data. Initial maps made from the
grids with Generic Mapping Tools (GMT) revealed many important features such as
reef terraces, erosional remnants, volcanic edifices, and blocks of reef debris (below). Mapping of
the Pago Pago harbor also captured in striking detail the wreckage of the USS
Chehalis, a WWII oil and gas tanker that exploded and sank in the harbor in
1949, and may be still be a source of water pollution (below).
Index map of Tutuila, American
Samoa with pink circles showing the locations of recent multibeam bathymetric
surveys around the island. Inset photograph at lower left is an aerial shot of
the FBNMS (photo courtesy of the FBNMS, www.fbnms.nos.noaa.gov).
Codes for other survey areas: NP = National park of American Samoa (total area
of submerged national park offshore Tutuila is ~5 sq. km); PPH = Pago Pago
Harbor; TB = Taema Bank; FB = Faga'itua Bay. Map is based on a U.S. Geological
Survey (USGS) 10-m digital elevation model (DEM) provided by A. Graves of Nuna
Technologies, American Samoa.
Histogram equalized, shaded relief bathymetric map of Taema Bank, a drowned
coral reef terrace located ~3 km off the south central coast of Tutuila.
Color-shaded, sun-illuminated bathymetric map featuring the wreck of the USS
Chehalis in Pago Pago Harbor (cartography by B. Donahue). Inset photo of a ship
in the same class as the USS Chehalis courtesy of the U.S. National Archives
and Records Administration.
In order to make all data sets in the
FBNMS GIS accessible, not only to the sanctuary staff and their collaborators
in American Samoa, but to collaborators throughout Oceania and the U.S., a web
clearinghouse was built ((dusk.geo.orst.edu/djl/samoa), providing links to all of the GIS data and
metadata, and to bathymetric grids in GMT format for non-GIS users, various
maps, photographic images, and graphics. All GIS data are provided as ArcInfo
export interchange files (i.e., *.e00 files), which may be imported into
ArcInfo, ArcView, or ArcExplorer.
"Ground-truthing" of bathymetric
surveys with photography and videography will be an ongoing endeavor. For
example, the new bathymetry of the FBNMS helped to guide the location of a
deep-diving mission to the sanctuary on May 16, 2001 . University of Hawaii researcher Richard Pyle used
rebreather technology to work underwater for over 3.5 hours (a block of time
significantly longer than traditional SCUBA), and collected videotape of coral
reef biota and habitats up to a maximum depth of 113 m. Although the diving
mission was cut short by poor weather, twelve completely new species of fish were
observed in the bay, including seventeen species that had never before been
observed in American Samoa, and several species that were previously unknown to
the waters of Fagatele Bay (see
Richard Pyle's Coral Reef Twilight Zone Site
for rebreather results and images).
Pacific
Islands GIS
A fortuitous
occurrence at the time of bathymetric surveying and GIS activities for the
FBNMS was the visit of a NOAA Coastal Services Center delegation to involve
American Samoa in a new Pacific Islands GIS initiative. The initiative, begun
in April of 2001, is a multiyear initiative to build sustainable spatial data
capacity within the coastal resource management programs of Hawaii, and the
U.S. territories of American Samoa, Guam, the Commonwealth of the Northern
Mariana Islands, and to leverage other related federal activities in the
western Pacific. A major goal is to develop full, integrated GIS projects and
to keep this momentum going, especially in the wake of government contractors
who may do important GIS work but then must leave the territory. As such, the
initiative provides a 2-year assistantship through the Environmental Careers
Organization (ECO) for an individual with a professional degree and excellent
GIS and communication skills, to help meet the territory's GIS needs,
particularly through the local Coastal Zone Management Program. An intern was
placed in American Samoa in October 2001, and provided with hardware, ESRI
ArcView and ArcInfo software and extensions, and GPS units. The initiative has
also provided training to the territory in information technology, introductory
and intermediate ArcView, GPS, and metadata.
Of major significance
also was the establishment in 2001 of an American Samoa GIS User Group (Table
1), which has facilitated management of several of the aforementioned
environnmental issues and responsibilities. Led by the American Samoa
Government's Department of Commerce and comprised of ~30 representatives from
the various government agencies, as well as the American Samoa Community
College, the group performs a variety of important digital mapping and spatial
analysis tasks, including: inventory and organization of existing data;
development of a land information system; wetlands delineation maps for
Tutuila; and the use of satellite imagery to update territory base maps.
Table 1. Agencies with
interest or current participation in the American Samoa GIS User Group
|
American
Samoa Coastal Zone Management Program |
American
Samoa Community College |
|
American
Samoa Government, Department of Commerce |
American
Samoa Government, Department of Marine and Wildlife Resources |
|
American
Samoa Government, Department of Public Works |
American
Samoa Historic Preservation Office |
|
American
Samoa Power Authority |
Fagatele Bay
National Marine Sanctuary |
|
National
Park of American Samoa |
Natural
Resources Conservation Service, U.S. Department of Agriculture, American Samoa |
|
The Nature
Conservancy, American Samoa |
U.S.
Enviromental Protection Agency, American Samoa |
|
U.S. Fish
and Wildlife Service, American Samoa |
U.S. Forest
Service, American Samoa |
|
U.S.
Geological Survey, American Samoa |
|
The inception of the
user group was serendipitously coincident with recent bathymetric surveying
around the island, leading further to the establishment of the FBNMS GIS, as
well as renewed interest in the territory by NOAA and the USGS in connection
with the pressing need to now to monitor and protect Pacific coral reefs
(Anderson, 1999; U.S. Coral Reef Task Force, 2000).
SSE Mission
In March of
2002 SSE led a 1-week SCUBA diving, photography, fish count and public outreach
mission to American Samoa. A team consisting of Sylvia Earle (SSE), Kip Evans
(SSE), Gale Mead (SSE), Brian Donahue (USF), Laddie Akins (Reef Environmental
Education Foundation, REEF), and Nancy Daschbach, made 60 dives were to the
sanctuary and several other site around Tutuila, including an extensive
collection of underwater video and still images. Species observed and
documented included 30-50 species of corals, 4 different shark species, over
200 fish species, and 20 invertebrate species. It is hoped that future
activities may be georeferenced for incorporation into GIS (i.e., more
ground-truth).
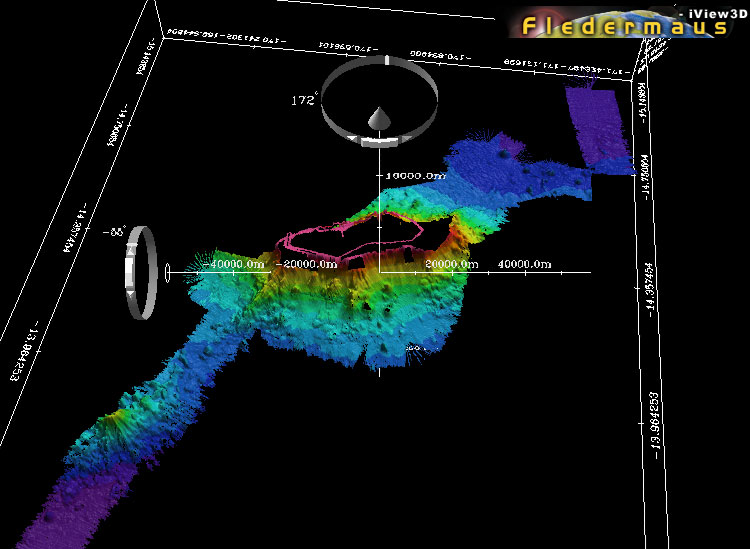
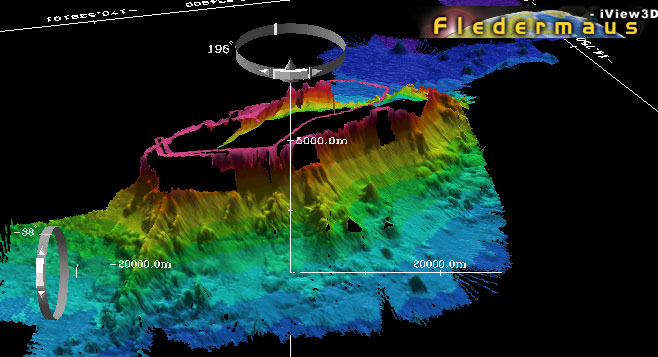
Another
activity that took place during the SSE mission was a 1-day multibeam
bathymetric mapping cruise aboard the R/V Revelle that, along with other
multibeam data mined from archives at the Scripps Institution of Oceanography,
enabled complete coverage of the mid- to deeper water flanks of Tutuila . These new data will supplement the aforementioned shallow water
surveys that were incorporated into the FBNMS GIS in 2001. During the Revelle cruise, the entire
north flank of Tutuila and several deepwater multibeam data gaps along the
southern flank were mapped with the Kongsberg-Simrad hull-mounted EM120 system,
revealing at least 6 new volcanoes off of the northern flank, as well as the
shape of banks along the south flank . Many of these
banks are inaccurately located on nautical charts and have never been fully
mapped with multibeam bathymetry.
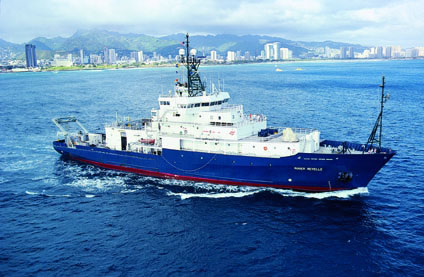
Photo (courtesy of Scripps Instituion of Oceanography) of the 273-foot R/V Roger
Revelle used for the deepwater multibeam bathymetric survey
around Tutuila in March 2002. 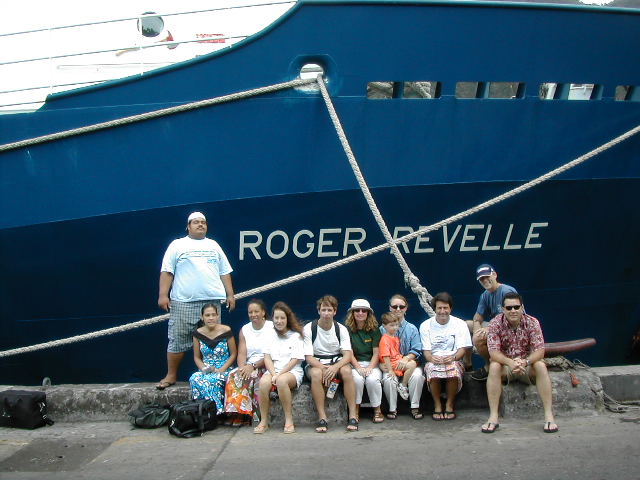
Shipboard science party (except for the little dude on his mom's lap) for the
Tutuila bathymetric survey.
Bathymetry
data are still being post-processed, and final maps and GIS grids will be
incorporated into the FBNMS and made available on the
web in late 2003.
Ongoing Initiatives
Additional shallow-water surveys were conducted in
November, 2002. In addition to bathymetry that is currently being processed, what will is also important is the processing of any available backscatter imagery (representing the
strength of the return signal rather than just the traveltime), so that
seafloor classification and habitat maps may be prepared for depths of 30 m and
greater. My students are currently integrating the bathymetry with high-resolution 1- and 4-m IKONOS
satellite imagery recently obtained from NOAA through the Coral Reef Task Force
Initiative. These maps will be the basis for ongoing studies in the sanctuary
and the park that will include selection of sites for habitat class designation
and protection (e.g., no-take marine protected areas), development of sanctuary
program monitoring protocols, and developing a general understanding species
composition and abundance. Other ongoing initiatives include:
- the completion of a spatial data framework
endorsed by the Governor of American Samoa.
- marine protected area designation.
- an aerial survey of the territory being
conducted by the Fish and Wildlife Services.
- appeals to Hawaii and Pacific Basin Islands
section of the USGS to make publicly available the actual orthoimagery
from which many of the USGS vector products are derived (for better
delineation of boundaries, archaeological sites, etc.).
- a memorandum of understanding between the
American Samoa User Group and Oregon State University for the exchange of
students and researchers, sharing of data and imagery, and the
implementation of cooperative research programs.
- new doctoral dissertation research by Eric
Treml of Duke University to investigate the ecological connectivity
between coral reef systems in American Samoa with GIS, to analyze the
effects of environmental stressors on these systems, and bring the results
to bear on marine protected area designation within the territory (E.
Treml, pers. comm., 2002).
- development of customized GIS tools for coral
mapping and assessment, shoreline change, hazards (especially vessel
groundings and oil spills), land permitting support.
Conclusion
It has been very encouraging to witness
the explosion of bathymetric mapping and GIS activity in American Samoa, and
this review has in no way been exhaustive. The concept of a
"territory-wide" GIS for American Samoa is still developing, and in
its current decentralized state, even with the formulation of a user group, a
continual challenge will be to get data into the hands of resource managers and
community activists, along with the tools and understanding of their usage that
will allow them to use the data for effective decision-making. And how to do
this while preventing duplication of efforts and services, and avoiding
competition for the small number of highly-trained GIS personnel in the
territory? One approach may be to take advantage of a student labor pool, both
on and off-island, especially via a mentorship or apprenticeship program,
supported by academic credits and training. The FBNMS has already initiated
this, having provided travel support for OSU students to help with mapping and
GIS coordination on Tutuila. Indeed, it has been argued by Oberlin (1996) that
"the infrastructure most needed to support the information era is financial,
social, and political, not technical."
Now, a primary question for YOU in the
"audience" is, given the data that are now available for the FBNMS,
what specific coral reef management or research questions might you ask and
tackle with a GIS? I hope that we can discuss this at length during the
workshop, along with any other questions or comments that you might have. And
some of you may be interested in preparing an annotated bibliography of
Internet resources related to this.
To get you started, Bridgewater (1993) and
Aspinall (1995) note that combining a landscape ecology approach (i.e., data
analysis guided by purposeful ecological objectives) with a GIS is desirable
because it allows for the study of structure, function and change within coral
reef systems, while attempting to manage the many spatial and temporal scales.
For the April-May 2001 survey, a primary long-term objective is analyze
physical factors important to coral reef development in FBNMS, such as habitat
classification, submarine aspect, submarine slope, and bottom substrate relief,
along with several community descriptors, via GIS query, spatial correlation
tests, and "buffer analysis" (I'd be happy to explain these in more
detail during our discussion). Treml (1999) was successful with this approach in
analyzing coral reef community ecology on St. John, U.S. Virgin Islands using
factors such as current regime, substrate characteristics, coastal topography,
bay geometry, watershed size, sedimentation, tropical storm impact, bathymetry,
biodiversity, evenness biota distribution, and algae cover.
Thanks for reading this far, and have a
wonderful time during the remainder of the CEO workshop!
Acknowledgments
Many thanks
to Nancy Daschbach, manager of the Fagatele Bay National Marine Sanctuary with
whom the author originally made contact in order to start a wide range of
collaborations. Brian Donahue and Dave Naar of the University of South Florida
Center for Coastal Ocean Mapping have provided excellent multibeam mapping and
data processing support. Ken Crouse of OSU Geosciences is thanked for tireless
computer technical support in rebuilding GIS files and software in American
Samoa during the summer of 2001. Mark Hayward of the American Samoa Government
Department of Commerce and Allison Graves of Nuna Technologies and the National
Park of American Samoa have been invaluable in providing data and GIS assistance,
and are thanked also for fruitful discussions. Allison and Kevin Cronk, the
NOAA Pacific Island GIS intern for American Samoa, have worked tireless on
procedures for converting from American Samoa 1962 Datum, stateplane
coordinates to North American Datum, UTM coordinates. Cindy Fowler and Lori
Cary-Kothera are thanked for their leadership of the Pacific Island GIS intern
program for American Samoa. Jennifer Aicher, Dave Kulberg, Champion Matu'u, and
Florence Lutu (American Samoa Community College), Kevin Cronk (American Samoa
Government), and Allison Graves and Stassia Samuels (National Park of American
Samoa) are thanked for excellent watchstanding at sea. And finally, Tony
Beecham of the American Samoa Department of Marine and Wildlife Resources is
thanked for general support and good humor. The author was supported by
National Science Foundation (NSF) grant OCE/EHR-0074635, with additional travel
funds provided by the Fagatele Bay National Marine Sanctuary. Supplemental ship
time for the R/V Roger Revelle in order to complete the deepwater
multibeam survey around Tutuila was funded by grants NSF-OCE-0002312 to D.
Naar, NOAA-408BNC101000 to D. Wright, and NSF-OCE-0074635 to D. Wright.
References
and Further Reading
Akins, L., 1999.
Deep-water fish assemblage characterization of the National Marine Sanctuaries,
Sustainable Seas Mission Abstract, weblink
Allison,
G.W., J. Lubchenco and M.H. Carr, 1998. Marine reserves are necessary but not
sufficient for marine conservation, Ecological Applications, 8(1): S79-S92.
Anderson,
C.L. (ed.), 1999. U.S. All Islands Coral Reef Initiative Strategy: Workshop
Report of the University of Hawaii Social Science Research Institute and the
Pacific Basin Development Council with the US All Islands Coral Reef Initiative
Coordinating Committee, Representing the Territory of American Samoa, the
Commonwealth of the Northern Mariana Islands, the State of Hawaii, the
Territory of Guam, the Commonwealth of Puerto Rico, and the Territory of the
U.S. Virgin Islands, Honolulu, HI, University of Hawaii, online at www.hawaii.edu/ssri/Is_CRI.html
Aspinall, R.J., 1995. Geographical
information systems: Their use for environmental management and nature
conservation, Parks, 5(1):
20-31.
Birkeland, C.E., R.H. Randall, R.C. Wass,
B. Smith, and S. Wilkins, 1987. Biological Assessment of the Fagatele Bay
National Marine Sanctuary, NOAA
Technical Memorandum, 232 pp.
Bridgewater, P.B., 199 Landscape ecology,
geographic information systems and nature conservation, in R. Haines-Young,
D.R. Green and S. Cousins (eds.), Landscape Ecology and Geographic
Information Systems, Taylor and
Francis, London, 23-36.
Craig, P., 1998. Temporal spawning
patterns for several surgeonfishes and grasses in American Samoa. Pacific
Science, 52:35-39.
Elliott, B., 2000. The Rebreather Web
Site, Northwood Designs, Inc.,
Antwerp, New York, weblink.
Green, A.L., C.E. Birkeland, R.H. Randall,
B.D. Smith, and S. Wilkins, 1997. 78 years of coral reef degradation in Pago
Pago Harbor: a quantitative record, Proceedings of the 8th International
Coral Reef Symposium, Panama City,
Panama, 2: 1883-1888.
Green, A.L., C.E. Birkeland, and R.H.
Randall, 1999. Twenty years of disturbance and change in Fagatele Bay National Marine
Sanctuary, American Samoa, Pacific Science, 53(4): 376-400.
Gubbay, S. (ed.), 1995. Marine
Protected Areas: Principles and Techniques for Management, Chapman and Hall, London.
Hart, S.R., H. Staudigel, A.A.P. Koppers,
J. Blusztajn, E.T. Baker, R. Workman, M. Jackson, E. Hauri, M. Kurz, K. Sims,
D.J. Fornari, A. Saal and S. Lyons, 2000. Vailulu'u undersea volcano: The new
Samoa, Geochemistry, Geophysics, Geosystems, 1: Paper number 2000GC000108.
Koenig, C., F. Coleman, G. Fitzhugh, C.
Gledhill, et al., in press, 2001. Marine reserves for the protection of
critical shelf-edge spawning habitat for economically important reef-fish. Bulletin
of Marine Science.
Oberlin, J.L., 1996. The financial
mythology of information technology: Developing a new game plan, CAUSE/EFFECT (now EDUCAUSE Quaterly ), 19(1), 21-29, online at www.educause.edu/ir/library/text/CEM9616.txt.
Saufea, F. S., 2002. Community-based
fisheries management in American Samoa, Proceedings of the Fifth Regional
Symposim, PACON 2001, Burlingame,
California.
Smith, W.H.F. and D.T. Sandwell, 1997.
Global seafloor topography from satellite altimetry, Science, 277:1957-1962.
Treml, E., 1999. Fringing Reef
Framework Development and Maintenance of Coral Assemblages along St. John's
South Shore: A Geographic Information System (GIS) Analysis, Master's thesis, University of Charleston,
Charleston, South Carolina.
U.S. Coral Reef Task Force, 2000. National
Action Plan for Coral Reef Conservation, Washington, DC, U.S. Department of the Interior, online at CoralReef.gov/doc.cfm.
Wright, D.J., B.T. Donahue, and D.F. Naar,
2002. Seafloor mapping and GIS coordination at America's remotest national
marine sanctuary (American Samoa), in Wright, D.J. (ed.), Undersea with GIS, Redlands, CA, ESRI Press, 33-63.
Dawn J. Wright
Professor
Department of Geosciences
104 Wilkinson Hall
Oregon State University
Corvallis, OR 97331-5506
Telephone: 541-737-1229
Fax: 541-737-1200
Email: dawn@dusk.geo.orst.edu
Panoramic digital
photo mosaic from aboard the R/V Roger Revelle by Stassia Samuels, National Park
of American Samoa, March 2002