|
|
|
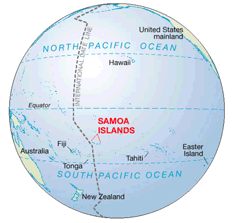
Figure 1. American Samoa lies
approximately 1,000 miles south of the equator,
over 2,200 miles from Honolulu, 4,525 miles from
Tokyo and 2,700 miles from Sydney (map courtesy of the National
Park of American Samoa).
|
|
|
|
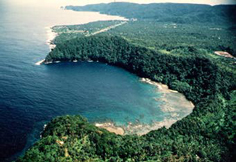
Figure 2. Fagatele Bay, in the SW corner of Tutuila, American Samoa, was
designated as a national marine sanctuary on April
29,1986.
|
Now that you've learned the basics of coral reef ecology, as well as the challenges and practices of coral reef conservation and management, I'm pleased to share some information about 2 critical mapping technologies that support these activities: multibeam surveying to derive the bathymetry (i.e., submarine topography) of coral reef environments, and geographic information systems (GIS) that can be used to map and integrate bathymetry with many other kinds of scientific and resource management data for the purposes of improved data interpretation, and managerial decision making. I'll spend some time briefly introducing the basics of these technologies and will then share some preliminary results from a recent shallow-water multibeam bathymetric surveys and GIS work conducted during April-May, 2001 in support of the Fagatele (Fohng-ah-téh-leh) Bay National Marine Sanctuary in American Samoa (Figures 1 and 2).
As you may already know, there are currently thirteen sites in the U.S. National Marine Sanctuary System that protect over 18,000 square miles of American coastal waters. Coral reefs are a particular concern at several of these sites, as reefs are now recognized as being among the most diverse and valuable ecosystems on earth, as well as the most endangered. The smallest, remotest, and least explored site is the Fagatele Bay National Marine Sanctuary (FBNMS) in American Samoa, the only true tropical coral reef in the sanctuary system. Before our surveys in April and May it was largely unexplored below depths of ~30 m, with no comprehensive documentation of the plants, animals, and submarine topography. Indeed, virtually nothing is known of shelf-edge (50-120 m deep) coral reef habitats throughout the world, and no inventory of benthic-associated species exists (e.g., Koenig et al., in press). It will be extremely difficult to meet the sanctuary's mission of protecting the coral reef terrace and broader marine ecosystem without adequate knowledge of the deeper environment. In addition, unlike the larger sanctuaries off the coast of the continental U.S. and Hawaii, logistical difficulties will prevent the DeepWorker submersible from visiting FBNMS on an SSE mission at any time in the near future. Because FBNMS is so remote, there has been a critical need there for regional-scale, high-resolution, fully processed, interpreted and accessible baseline data, in order to properly characterize the geological and biological environment.
|
|
|
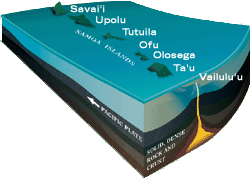
Figure 3. The islands of Western and American Samoa, presumed recently by scientists to have formed as overlying crustal plates moved over a stationary "hotspot" in the Earth's mantle (very similar to the formation of the Hawaiian islands; Graphic by Jayne Doucette, Currents magazine, Woods Hole Oceanographic Institution).
|
American Samoa (as opposed to the independent nation of Samoa directly to the west) is the only U.S. territory south of the equator (Figure 2) and is composed of five volcanic islands (from west to east: Tutuila, Anunu, Ofu, Olosega, and Ta'u), two small coral atolls, (Rose and Swain islands), and a recently-discovered submerged volcano named Vailulu'u (Hart et al., 2000). The total area of these islands is roughly 76 sq. mi. (about the size of Washington, DC) and has a population (except for Vailulu'u of course!) of approximately 64,000 people. Tutuila is 54 sq. mi. in area and contains over 90% of the territory's population.
The FBNMS is located at the southwest corner of the island of Tutuila (see Figure 2 above and Figure 4 below). The bay is an ancient flooded volcano, with a thriving coral and calcareous algal reef community that is rapidly recovering from an infestation of crown-of-thorns starfish that devastated the corals in the late 1970s, as well as the effects of 2 hurricanes in the early 1990s (Birkeland, et. al., 1987). Although much of the coral cover was destroyed, fish populations still thrive, particularly surgeonfish, damselfish and angelfish (Birkeland et al., 1987; Craig, 1998). In 2001, after a follow-up survey by Dr. Charles
Birkeland of the University of Hawaii, the reefs of the Bay were judged
to be "recovered." In addition, the steep slopes surrounding the bay contain some of the rarest paleo-tropical rainforests in the U.S. (http://www.fbnms.nos.noaa.gov). One of the greatest threats currently facing Fagatele Bay, as well as much of Samoa's coastal waters, is the rapid depletion of fish stocks by the illegal use of gill netting, spearfishing, poison and dynamite (Sauafea, in press). In addition, the sanctuary staff is concerned about the potential for algal blooms with subsequent incidents of hypoxia (extremely low dissolved oxygen in the water) due to unchecked sewage outflow "upstream" from the bay.
Scientific and Management Objectives
Prior to the April-May 2001 mission, no scientific survey had been conducted in the deepest parts of Fagatele Bay. Two previous surveys reached depths of ~43 m, but were both were only brief, localized "snapshots": an algal reconnaissance in 1996 (N. Daschbach, unpublished data, 1996), and a rapid assessment survey for fish and coral in 1998 (Green et al., 1999). Therefore, two primary surveying objectives during the 2001 mission were to obtain: (1) complete topographic coverage of the ocean floor via a portable multibeam bathymetric mapping system; and (2) digital video and still photography of the biological habitats and physical features below 30 m via SCUBA and rebreather technology. In contrast to SCUBA, where the entire breath of a diver is expelled into the surrounding water when s/he exhales (open circuit), a rebreather apparatus is able to "reuse" the oxygen left unused in each exhaled breath (closed or semi-closed circuit), resulting in greatly extended dive times that are relatively quiet (little or no bubbles produced) and with much smaller tanks (Elliot, 2000). We'll focus here primarily on the bathymetric mapping survey and subsequent GIS work. Specific research questions that guided surveying included:
- the primary question of exactly what is there! What is the
character of the seafloor from 30-m depth inshore out to the boundaries
of the sanctuary (e.g., vertical relief; average depth,
morphology and extent of the reef and/or algal cover, etc.)?
And further, what organisms and habitats currently reside within the
sanctuary? Birkeland et al., (1987) and Green et al. (1997 and 1999)
are the only existing reports on the first long-term, qualitative
record of coral reef degradation in the region.
- In 1996 visiting divers to the sanctuary reported unusually large fleshy algal blooms at ~43 m depth, suggesting a nutrient source in the bay that should be identified and monitored, particularly if chronically harmful (N. Daschbach, unpublished data). Is it likely that the nutrient source is human-induced (e.g., sewage outfall carried to the bay along prevailing westerly currents or underground seepage into the bay from a landward watershed), and where are the most appropriate sites for long-term monitoring of water quality and ocean currents?
-
What are the broader implications for coral reef conservation and management (Gubbay, 1995; Allison et al., 1998)? For example, which sites should be of special biologic significance (such as a no-take zone or an area exhibiting a high degree of biological diversity)?
-
Further questions may even be developed by local high school and community college students as part of the ongoing educational outreach on the island conducted by the FBNMS staff.
A "Crash Course" in Ocean Floor Mapping and GIS!
|
|
|
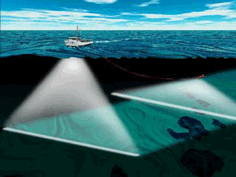
Figure 4. A typical
multibeam bathymetric system operating from the hull of a large (200-300 ft.-long) deepsea research vessel (graphic courtesy of NOAA). In this picture a multibeam system is mounted on a vehicle being towed behind
the ship as well.
Acoustic
pulses are sent out in "swaths" - "mow the lawn" with these swaths usually results
in complete coverage of the ocean floor. The system used in American Samoa
was a portable instrument mounted on the bow of a small, 30-ft., survey boat .
|
Did you know that we have made more progress mapping the neighboring planets than we have our own "seven seas? Indeed, we know more about the dark side of the moon and the topography of Venus and Mars than we do of our ocean floors (or "seafloor" or "seabed"). When NASA announced that its high-profile Shuttle Ray Topography Mission had mapped eighty percent of the earth's surface, they neglected to mention that they had skipped the parts that are underwater (71% percent of the globe's actual surface area) which remained impervious to the Shuttle's spectacular remote sensors.
When viewed from space, the Earth appears strikingly as a planet of water, with 71% of it surface covered by a fluid envelope averaging 5000 m in depth. This envelope is a vast inner space, which, along with the underlying ocean floor, is still only dimly perceived by humans. What can be perceived of the water column and ocean floor must be done mostly with the aid of sound, as sound waves are transmitted both farther and faster through seawater than electromagnetic energy. In order to "see" the ocean floor for instance, sound is essential not only for determining depth to the bottom, but for detecting varying properties of the bottom. In a typical multibeam bathymetric mapping system (Figure 4), multiple pulses of sound are released and form beams on their way down to the ocean floor. The sound reflects back after striking an object on the ocean floor Depths are commonly measured by timing the two-way travel time of a sound pulse from ocean bottom back to the ship.
As the speed of sound in seawater varies linearly with temperature, pressure, and salinity, the conversion of travel time to depth must take this into account.
In addition, the intensity of this reflection, or backscatter, can be used to resolve the shapes of objects or the character of the bottom (e.g., heavily sedimented and thus non-reflective or glassy with fresh lava flows and thus extremely reflective).
|
|
|
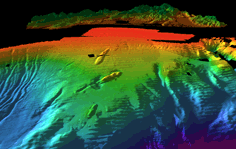
Figure 5. Three-dimensional visualization
of the ocean floor and accompanying shoreline and mountains along N. California, created with a scientific visualization package and a GIS by Dr. Larry Mayer and colleagues at the U. of New Hampshire's Center for Coastal and Ocean Mapping.
|
The resulting maps from this system are perfect fodder for GIS, both for display and interpretation of bathymetric data sets (Figure 5) but also for integration, comparison, and analysis with other kinds of data (biological data on coral reef species, temperature and chemistry of the water column above the ocean floor, and data on bottom currents, as well as boundaries delineating sanctuary limits, no-take zones, etc.; Figure 6). The high cost of acquiring these data often singularly justifies the development of dedicated GISs for the integration of these data. And by using GIS, the synergy of different types of data provides oceanographers with more information and insight than could be obtained by considering each type of data separately.
|
|
|
Figure 6. GIS, the key to data integration, analysis,
and understanding (graphic courtesy of ESRI).
|
So what is GIS?
A GIS is basically a computerized mapping and database system that helps to integrate and analyze data of various types. With GIS, not only do you have the map itself, you also have important information about the features on the map. GIS maps are thus often referred to now as "smart" maps because you have a whole database of information and a powerful suite and statistical and mathematical analysis tools "magically" connected to the points, lines, areas, and surfaces that you would normally see on a paper map. The data in GIS are like layers in a sandwich (Figure 6), except that the layers represent information about a geographical place to give you a better understanding of that place. The "meat", for instance, might be the ocean floor; the lettuce, the types and properties of various kinds of corals; the cheese, the temperature or salinity of the water, etc.. We can keep adding layers to the system such as directions of bottom currents, or locations of shipwrecks. And we may see changes in these layers through time.
GIS was first heavily used by scientists in the forestry, civil engineering, and conservation biology communities for various terrestrial applications. It is now beginning to make a quite a splash in the field of oceanography as well. The integration of multidisciplinary data gathered from many different kinds of vehicles or instruments is of great importance in oceanography, where geologists, chemists, biologists and physicists must often work together in order to understand the "big picture" of ocean processes.
As agencies and institutes such as the National Oceanic and Atmospheric Administration (NOAA) National Marine Sanctuary Program and National Ocean Service, the U.S. Geological Survey (USGS), and the Monterey Bay Aquarium Research Institute adopt GIS, itÕs becoming clear that not only are the needs of basic science and exploration being served, but those of ocean protection, preservation, and management as well. Exponential improvements in the speed and capacities of computer hard- and software, an accompanying drop in prices, and the increased availability of skilled practitioners in GIS are making implementation possible where costs have been, until very recently, prohibitive. Data, too, is easier to obtain via the Internet, the World Wide Web, and numerous public sources of spatial information, such as the National Geophysical Data Center, the NASA-funded Distributed Oceanographic Data System (DODS), the EarthExplorer of the USGS, and the Federal Geographic Data Committee's National Geospatial Data Clearinghouse. I'd be happy to provide links and explanations for these sources during our discussion. And finally, although the realization of true 3-dimensionality remains a challenge (particularly in the marine/coastal realm where there are dissimilarities between the horizontal and vertical dimensions), the mapping of our oceans continues to be an area of research that pushes the boundaries of a new field called geographic information science, compelling significant attention from funding agencies such as the National Science Foundation and the NOAA Office of High Performance Computing and Communications.
There are many additional sites that I can point you to regarding ocean floor mapping and GIS, but for now you may really enjoy an excellent piece written by Dr. Robert Aguirre for NOAA's new Ocean Exploration site:
NOAA Marine GIS Overview
Also:
The "Pirates' Pick of Seafloor Mapping and GIS Links from Davey Jones' Locker
Two recent books on these subjects are:
Marine and Coastal Geographical Information Systems
Undersea with GIS, from which a good portion of this keynote has been drawn.
Back to American Samoa: Coral Reefs... and Shipwrecks Too!
|
|
|
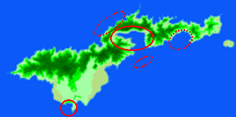
Figure 7.
Principal (solid circle) and secondary
(dotted circle) coral reef sites around Tutuila, American Samoa, surveyed with multibeam bathymetry. Solid circle in
far southwest corner is FBNMS. Solid circle in south central part of island is Pago Pago harbor. Dotted circle to the north of that is a secondary survey
area for the National Park of American Samoa survey areas. Dotted
circle to east of Pago Pago Harbor is Faga'itua Bay and to the south of it
is Taema Bank.
|
And now I'd like to return our discussion to our survey sites in American Samoa (Figure 7) and present some preliminary results of: (1) recent multibeam surveys to obtain complete topographic coverage of the
deepest parts of FBNMS, as well as Pago Pago Harbor, the largest deepwater harbor in the south Pacific,
and (2) efforts to integrate these baseline data into a GIS to facilitate integration with subsequent digital video and still photography of physical features and biological habitats gathered at the FBNMS, as well as key management and research problems.
Shallow-water, multibeam depth soundings were gathered by the Kongsberg-Simrad EM-3000 system, contracted from the University of South Florida College of Marine Studies, and operated from a boat owned by the Department of Marine & Wildlife Resources of the American Samoa Government. The Kongsberg-Simrad EM-3000 fans out up to 121 acoustic beams at a 130 degree angle and a frequency of 300 Khz (NOT harmful to marine life), yielding swaths that are up to 4 times the water depth. The system can capture depths in the 3-150 m range at survey speeds of 3-12 knots. With differential GPS (not available in real-time during our surveys), the system is capable of centimeter resolution with an accuracy of 10-15 cm.
|
|
|
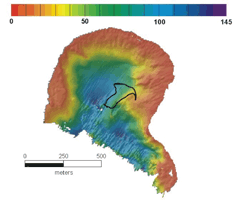
Figure 8. Map of the FBNMS seafloor.Irregular polygon shows location of rebreather dives. Cartography by Brian Donahue, University of South Florida and Richard Pyle of the Bernice Pauahi Bishop Museum.
|
|
|
|
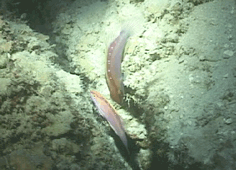
Figure 9. A new species of Cirrhilabrus, only recently discovered on deep-reefs in Fiji and never before seen in American Samoa. It was sighted on rebreather dives made with the aid of the multibeam bathymetry. This shot taken by Richard Pyle at a depth 113 m, on May 16, 2001.
|
Maps created with data from the Kongsberg-Simrad multibeam system are of excellent quality in terms of both the geological and manmade features that are detailed in them (Figures 8 and 10). The data will be suitable as base layers for the purposes of visual overlay and comparison with other data sets in the FBNMS GIS, and subsequent spatial analyses. Figure 8 shows the results of processing the bathymetric data and then "gridding" it an interval of 1-m to produce the color shaded map of the ocean depths (reds and yellows are shallow, blues and purples are deep). Gridding and interpretation of all the multibeam data are still ongoing. The map in Figure 8 gives a good initial picture of the physical structure of the reef platforms in the sanctuary, and also helped to guide the location of a deep-diving mission to FBNMS on May 16th, immediately after the bathymetric surveys had been completed. Divers used the aforementioned rebreather technology to stay on the ocean floor for periods of time longer than traditional SCUBA and took numerous digital photographs and video of coral reef biota (see
Richard Pyle's Coral Reef Twilight Zone Site
for results and images). Even though the diving mission was cut short by poor weather, several new species of fish were discovered in the deepest, previously unsurveyed and unexplored portions of the FBNMS (Figure 9 and see Richard's site).
|
|
|
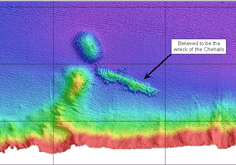
Figure 10. 1-m bathymetric grid of the wreck of the USS Chehalis Pago Pago Harbor. The USS Chehalis was a World War II oil and gas tanker that exploded and sank in the harbor in 1949. It is thought to be still be a source of pollution in the harbor. Image prepared by Brian Donahue, University of South Florida.
|
|
|
|
Figure 11. Screen dump of the new FBNMS GIS including all multibeam bathymetry grids, as well as compilation of GIS data layers obtained originally from the National Park Service, the USGS, the Digital Chart of the World, and other sources. Unfortunately , you can't see all the data integration in this one "snapshot" but the top view shows a US Geological Survey digital elevation model (in shades of green) for the main island of Tutuila.
|
Processed and gridded multibeam data were converted to GIS format and them incorporated into the system (Figure 11). Individual database records detailing how the data sets were collected and processed, their accuracy and resolution, potential errors in the data, whom to contact with questions about the data, etc. (in other words, the metadata for a data set) were prepared as well. You may download current maps, images and GIS data and metadata from the FBNMS GIS Data Archive. The site provides GIS data from the recent shallow-water multibeam bathymetric surveys, as well as a compilation of GIS data layers obtained originally from the National Park Service, the USGS, the Digital Chart of the World, and other sources, as well as GMT grids, maps, and various photographic images and graphics. All GIS data are provided in format that may be read by the GIS packages ArcInfo, ArcView, or ArcExplorer. Please take some time to review the site and see/download what is available.
Conclusion
A primary question for YOU in the "audience" is, given the data that are now available for the FBNMS, what specific coral reef management or research questions might you ask and tackle with a GIS? I hope that we can discuss this at length during the workshop, along with any other questions or comments that you might have. And some of you may be interested in preparing an annotated bibliography of Internet resources related to this.
To get you started, Bridgewater (1993) and Aspinall (1995) note that combining a landscape ecology approach (i.e., data analysis guided by purposeful ecological objectives) with a GIS is desirable because it allows for the study of structure, function and change within coral reef systems, while attempting to manage the many spatial and temporal scales. For the April-May 2001 survey, a primary long-term objective is analyze physical factors important to coral reef development in FBNMS, such as habitat classification, submarine aspect, submarine slope, and bottom substrate relief, along with several community descriptors, via GIS query, spatial correlation tests, and "buffer analysis" (I'd be happy to explain these in more detail during our discussion). Treml (1999) was successful with this approach in analyzing coral reef community ecology on St. John, U.S. Virgin Islands using factors such as current regime, substrate characteristics, coastal topography, bay geometry, watershed size, sedimentation, tropical storm impact, bathymetry, biodiversity, evenness biota distribution, and algae cover.
Thanks for reading this far, and have a wonderful time during the workshop!
References
Allison, G.W., J. Lubchenco and M.H. Carr, 1998. Marine reserves are necessary but not sufficient for marine conservation, Ecological Applications, 8(1): S79-S92.
Aspinall, R.J., 1995. Geographical information systems: Their use for environmental management and nature conservation, Parks, 5(1): 20-31.
Birkeland, C.E., R.H. Randall, R.C. Wass, B. Smith, and S. Wilkins, 1987. Biological Assessment of the Fagatele Bay National Marine Sanctuary, NOAA Technical Memorandum, 232 pp.
Bridgewater, P.B., 199 Landscape ecology, geographic information systems and nature conservation, in R. Haines-Young, D.R. Green and S. Cousins (eds.), Landscape Ecology and Geographic Information Systems, Taylor and Francis, London, 23-36.
Craig, P., 1998. Temporal spawning patterns for several surgeonfishes and grasses in American Samoa. Pacific Science, 52:35-39.
Elliott, B., 2000. The Rebreather Web Site, Northwood Designs, Inc., Antwerp, New York,
weblink.
Green, A.L., C.E. Birkeland, R.H. Randall, B.D. Smith, and S. Wilkins, 1997. 78 years of coral reef degradation in Pago Pago Harbor: a quantitative record, Proceedings of the 8th International Coral Reef Symposium, Panama City, Panama, 2: 1883-1888.
Green, A.L., C.E. Birkeland, and R.H. Randall, 1999. Twenty years of disturbance and change in Fagatele Bay National Marine Sanctuary, American Samoa, Pacific Science, 53(4): 376-400.
Gubbay, S. (ed.), 1995. Marine Protected Areas: Principles and Techniques for Management, Chapman and Hall, London.
Hart, S.R., H. Staudigel, A.A.P. Koppers, J. Blusztajn, E.T. Baker, R. Workman, M. Jackson, E. Hauri, M. Kurz, K. Sims, D.J. Fornari, A. Saal and S. Lyons, 2000. Vailulu'u undersea volcano: The new Samoa, Geochemistry, Geophysics, Geosystems, 1: Paper number 2000GC000108.
Koenig, C., F. Coleman, G. Fitzhugh, C. Gledhill, et al., in press, 2001. Marine reserves for the protection of critical shelf-edge spawning habitat for economically important reef-fish. Bulletin of Marine Science.
Sauafea, F. S., in press, 2001. Community-based fisheries management in American Samoa, Proceedings of the Fifth Regional Symposim, PACON 2001, Burlingame, California.
Treml, E., 1999. Fringing Reef Framework Development and Maintenance of Coral Assemblages along St. John's South Shore: A Geographic Information System (GIS) Analysis, Master's thesis, University of Charleston, Charleston, South Carolina.

Last update: December 10, 2002