 |
|
|
|
|
|
|
|
|
|
|
|
|
|
|
|
|
|
|
|
|
|
|
|
|
|
|
|
|
|
|
|
|
|
|
|
|
|
|
|
|
|
|
|
|
|
|
|
|
|
|
|
|
|
|
|
|
|
|
|
|
|
|
|
|
|
|
|
|
|
|
|
|
|
|
|
|
|
|
|
|
|
|
|
|
 |
|
 |
|
|
|
Using GIS to Prioritize Watershed Restoration Efforts in the Willamette Valley, Oregon |
|
|
|
|
|
|
|
An Annotated Bibliography |
|
|
|
|
|
|
|
|
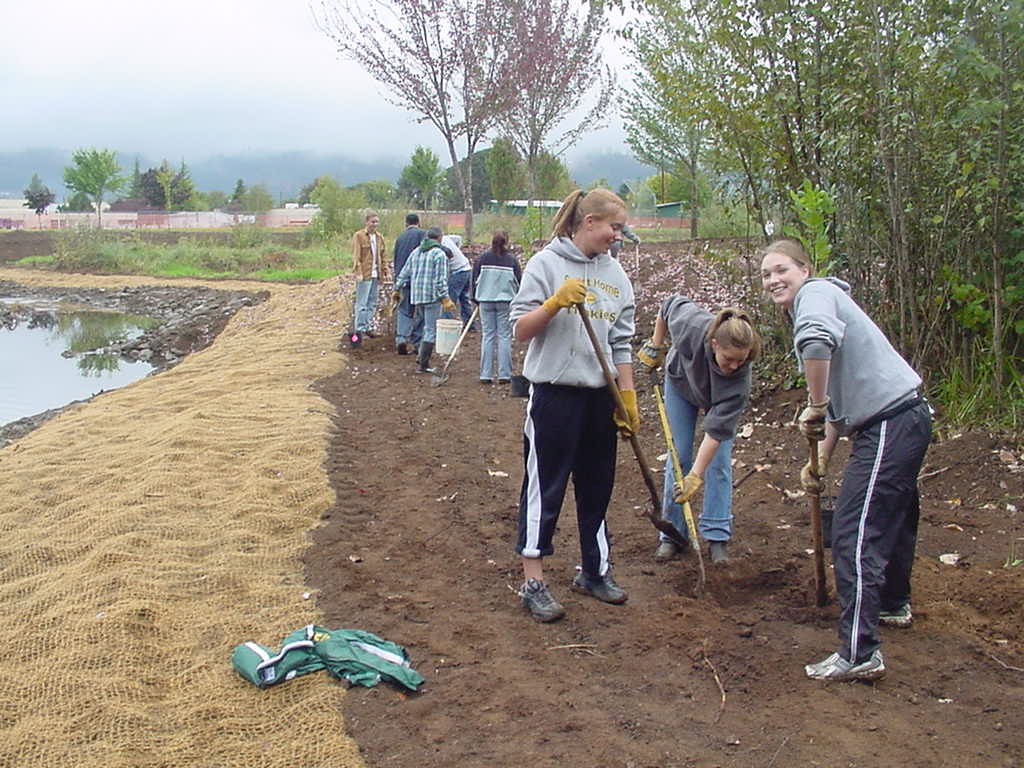
Students planting native riparian vegetation |
|
|
|
|
by Eric Hartstein |
|
|
|
|
|
|
|
GEO 565 |
|
|
|
|
|
|
|
Introduction
Watershed restoration in the Willamette Valley has undertaken many
forms; from in-stream work that adds coarse woody debris into rivers
and streams for fish habitat, planting native riparian vegetation that
provides bank stabilization, wildlife habitat, and helps maintain cool
water temperatures, to upland oak restoration. A major challenge
for agencies dealing in natural resources and community groups
interested in restoration is how to prioritize work given the wide
variety of actions that can be taken. Geographic Information
Systems (GIS) allows planners and managers valuable tools including
mapping, storing and managing data, analyzing spatial
relationships. The following annotated bibliography shows how GIS
can be an asset to restoration planning. The articles focus on
biological and physical factors, but also touch on the social aspects
which are crucial for building community support for sustained
restoration. |
|
|
|
|
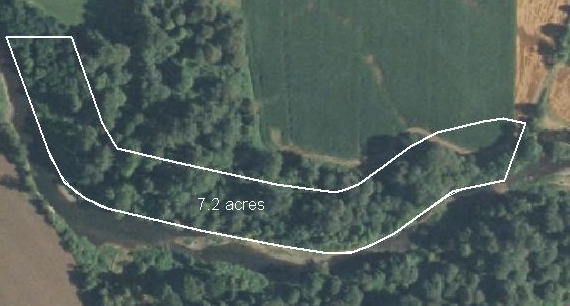
Using GIS to display riparian buffer |
|
|
|
 |
|
|
|
| Beachler,
R.E. 1996. “Hydrologic and Hydrographic Database Design in
Support of Anadromous Fisheries Restoration Planning.” ESRI 96 Conference Paper. |
|
|
|
|
|
This
is an interesting paper that should give restoration project planners
encouragement as to how far planning has advanced and improved in the
past ten years. In 1994, a working group was established to
prioritize restoration projects in the Klamath Basin, an important west
coast watershed for anadromous fish species. In order to
accomplish their task, GIS layers of anadromous fish presence, and
historical habitat were assembled. Additionally, hydrologic unit
boundary data layers were added (which at the time appeared to be a
relatively new way to plan restoration, given the amount of space
dedicated to this task). Finally, land ownership layers were
incorporated to give planners an idea of not only location of high
quality restoration habitat, but political feasibility as well.
This paper gives a good overview on how GIS plays an important planning
role, particularly when public funds are used for restoration.
Given that during the 1987-1995 timeframe, zero planning dollars were
allocated to the Lower Klamath sub-basin, while nearly $1.7 million was
spent on restoration, one wonders how effective these projects have
been. |
|
|
|
|
|
Heller,
D., McCammon B. and Uebel, J. June 2002. “Pacific Northwest
Region, Forest Service. Basin-scale Restoration Prioritization
Process”. Pacific Northwest Region, USDA Forest Service. |
|
|
|
|
|
This
straightforward paper documents how the U.S. Forest Service prioritizes
Pacific Northwest basins for restoration. It is intended for use
at the 3rd field hydrologic unit, but the model can be followed at a
finer scale more pertinent to localized groups. This model
introduces three categories of weighted analysis: aquatic
condition, watershed sensitivity, and management intensity.
Within each category, additional indicators are also weighted.
After categories are summed and weighted, total basin scores are
tabulated. GIS layers were used for many of the indicators within
the categories including “surface erosion risk, mass failure risk, and
road density. These data were matched with other data such as 303
(d) listings, presence of threatened and endangered species, and
biodiversity. Interestingly, the paper describes a professional
panel convened to make qualitative decisions based on the existing
data. This suggests that while quantitative data and GIS
utilization has aided in the prioritization process, there remains a
human element involved in important decision making. |
|
|
|
|
|
|
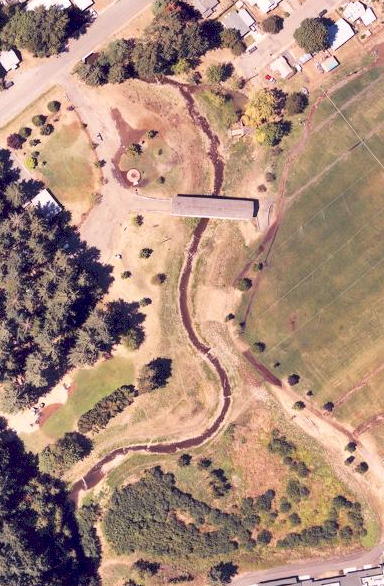
A completed stream restoration project in Sweet Home, OR. |
|
|
|
Sugumaran,
R., Meyer, J.C., and Davis, J. 2004. “A Web-based Environmental
Decision Support System (WEDSS) for Environmental Planning and
Watershed Management” Journal of Geographical Systems 6:307-322. |
|
 |
|
|
|
|
This
paper discusses a Web-based program for GIS maps in Missouri using “off
the shelf” data layers available to the public, such as endangered
species, soils, digital elevation, watershed boundaries, etc.
These layers were compiled and made available on the Internet, with a
user friendly-design. Web-based users have the option to weight
different variables in order to create a map which suites their purpose
(i.e. endangered species locations). This allows for managers,
planners, or community groups to prioritize based on the agency or
group’s own criterion. This author attempted to access the
web-site and was unsuccessful. |
|
|
|
Hyatt
T. L., Waldo T. Z. and Beechie T. J. 2004. “A Watershed Scale
Assessment of Riparian Forests, with Implications for Restoration”
Restoration Ecology 12(2): 175-183. |
|
|
|
The
authors seek to identify a model that assists planners in conducting
riparian restoration projects. Riparian zones are important for
fish species as they provide shade and lead to the formation of pools
which provide refugia for spawning and rearing fish. This study
used field data and aerial photos to conduct a GIS analysis. The
study area was the Nooksack, Skagit, and Stillaguamish watersheds in
Washington State. The study identified salmonid-bearing
tributaries and measured the adequacy of large woody debris given the
size of the tributary (i.e. medium size trees would allow for pool
formation in small and medium size streams, but not in some large
streams). The researchers found that 40% of the streams in the
study area provided sufficient wood that would form pools in that area,
23% likely will not provide sufficient wood, with another 15%
indeterminate. The remaining areas were in lakes, or mainstem
rivers. The results of the model were field-tested, with a 69%
match, with the majority of error occurring in the indeterminate range,
thus allowing for restoration planners to utilize the model to
prioritize riparian restoration projects. |
|
|
|
|
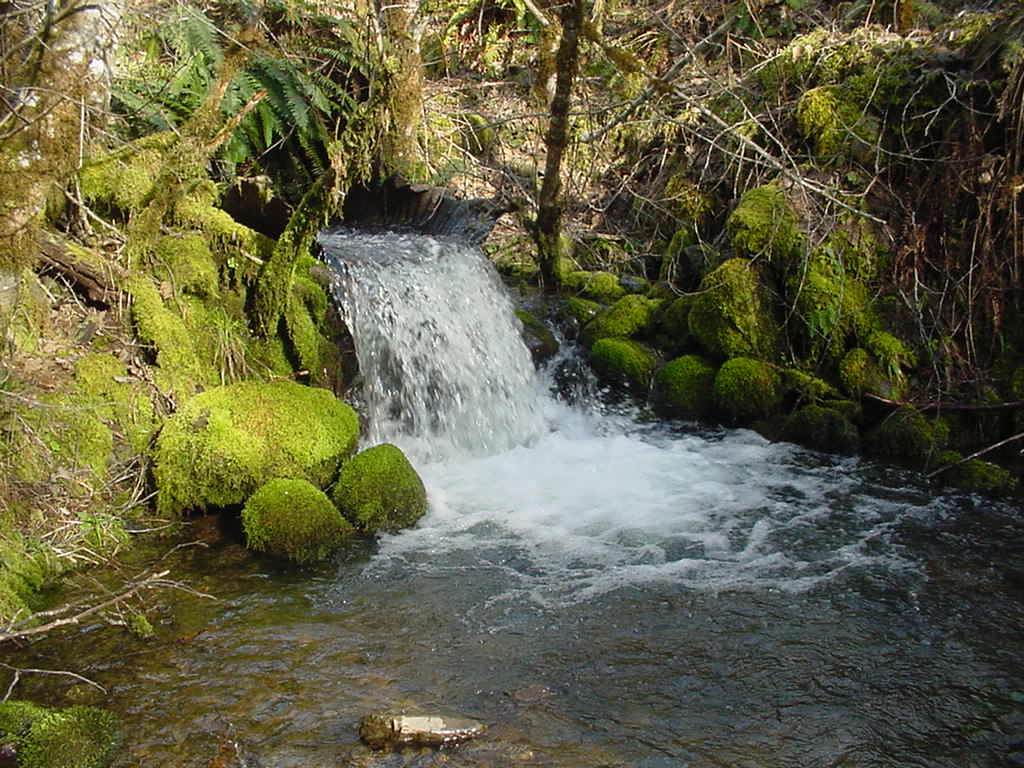
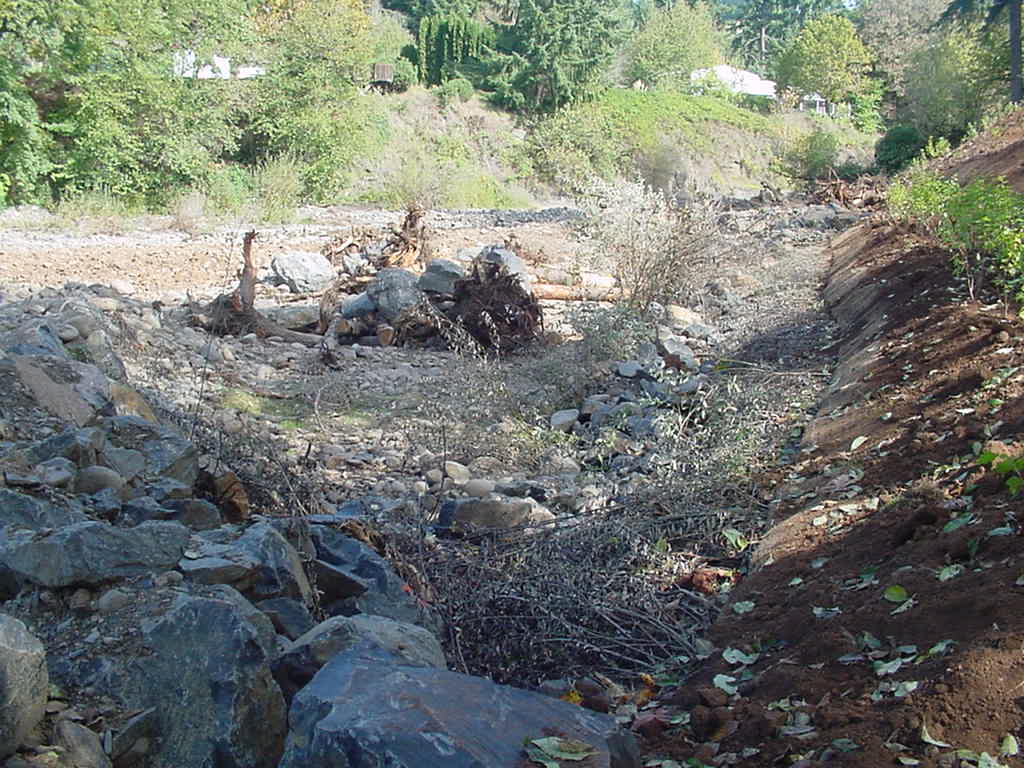
Culvert preventing fish passage |
|
|
|
|
|
|
 |
|
|
Long, E. 2005. “Using GIS to Connect Watersheds and People.” Proceedings of the Twenty-Fifth Annual ESRI User Conference. |
|
|
|
|
|
This
concise paper shows how GIS can be utilized by non-profit community
groups to assess watershed conditions, plan projects, evaluate
effectiveness of past and present projects, and, importantly,
accurately convey to the public what the issues are in the
watershed. The author briefly discusses two case studies in
which a community groups have used GIS for the duration of project
planning, implementation, and outreach to community members. The
ease and effectiveness of the latter GIS application appears to impress
the author greatly. |
|
|
|
|
|
Marcus,
L. and Lackey, L. 2005. “Prioritizing Restoration
Activities for Salmonid Habitat within a Watershed.” Proceedings of the Twenty-Fifth Annual ESRI User Conference. |
|
|
|
|
|
In
an attempt to prioritize restoration efforts in the Maacama Creek
watershed, which is a large tributary to the Russian River in
California, the authors utilized GIS to assemble data layers that
guided the prioritization process. Aerial photographs were
obtained from three different time frames (1942, 1961, and 2000) and
analyzed using the Georeferencing tool available from ESRI.
Through this analysis the following layers were made: watershed
roads, extent and density of riparian buffer, and vegetative clearing
for agriculture and timber harvest over the given time frame. The
results of the analysis point to widespread logging, and road building
in the watershed during the early 1960’s. Further analysis shows
that cleared areas from the 1960s have re-grown as hardwood, rather
than coniferous forests, which has resulted in a decrease in riparian
function for salmon habitat. With these analyses, the authors
were able to prioritize tributary restoration into high, medium, and
low categories, with the highest falling in areas with already cool
water but deficiencies in the riparian corridor. Low priorities
were in the lower watershed where upstream land practices have degraded
habitat. |
|
|
|
|
|
|
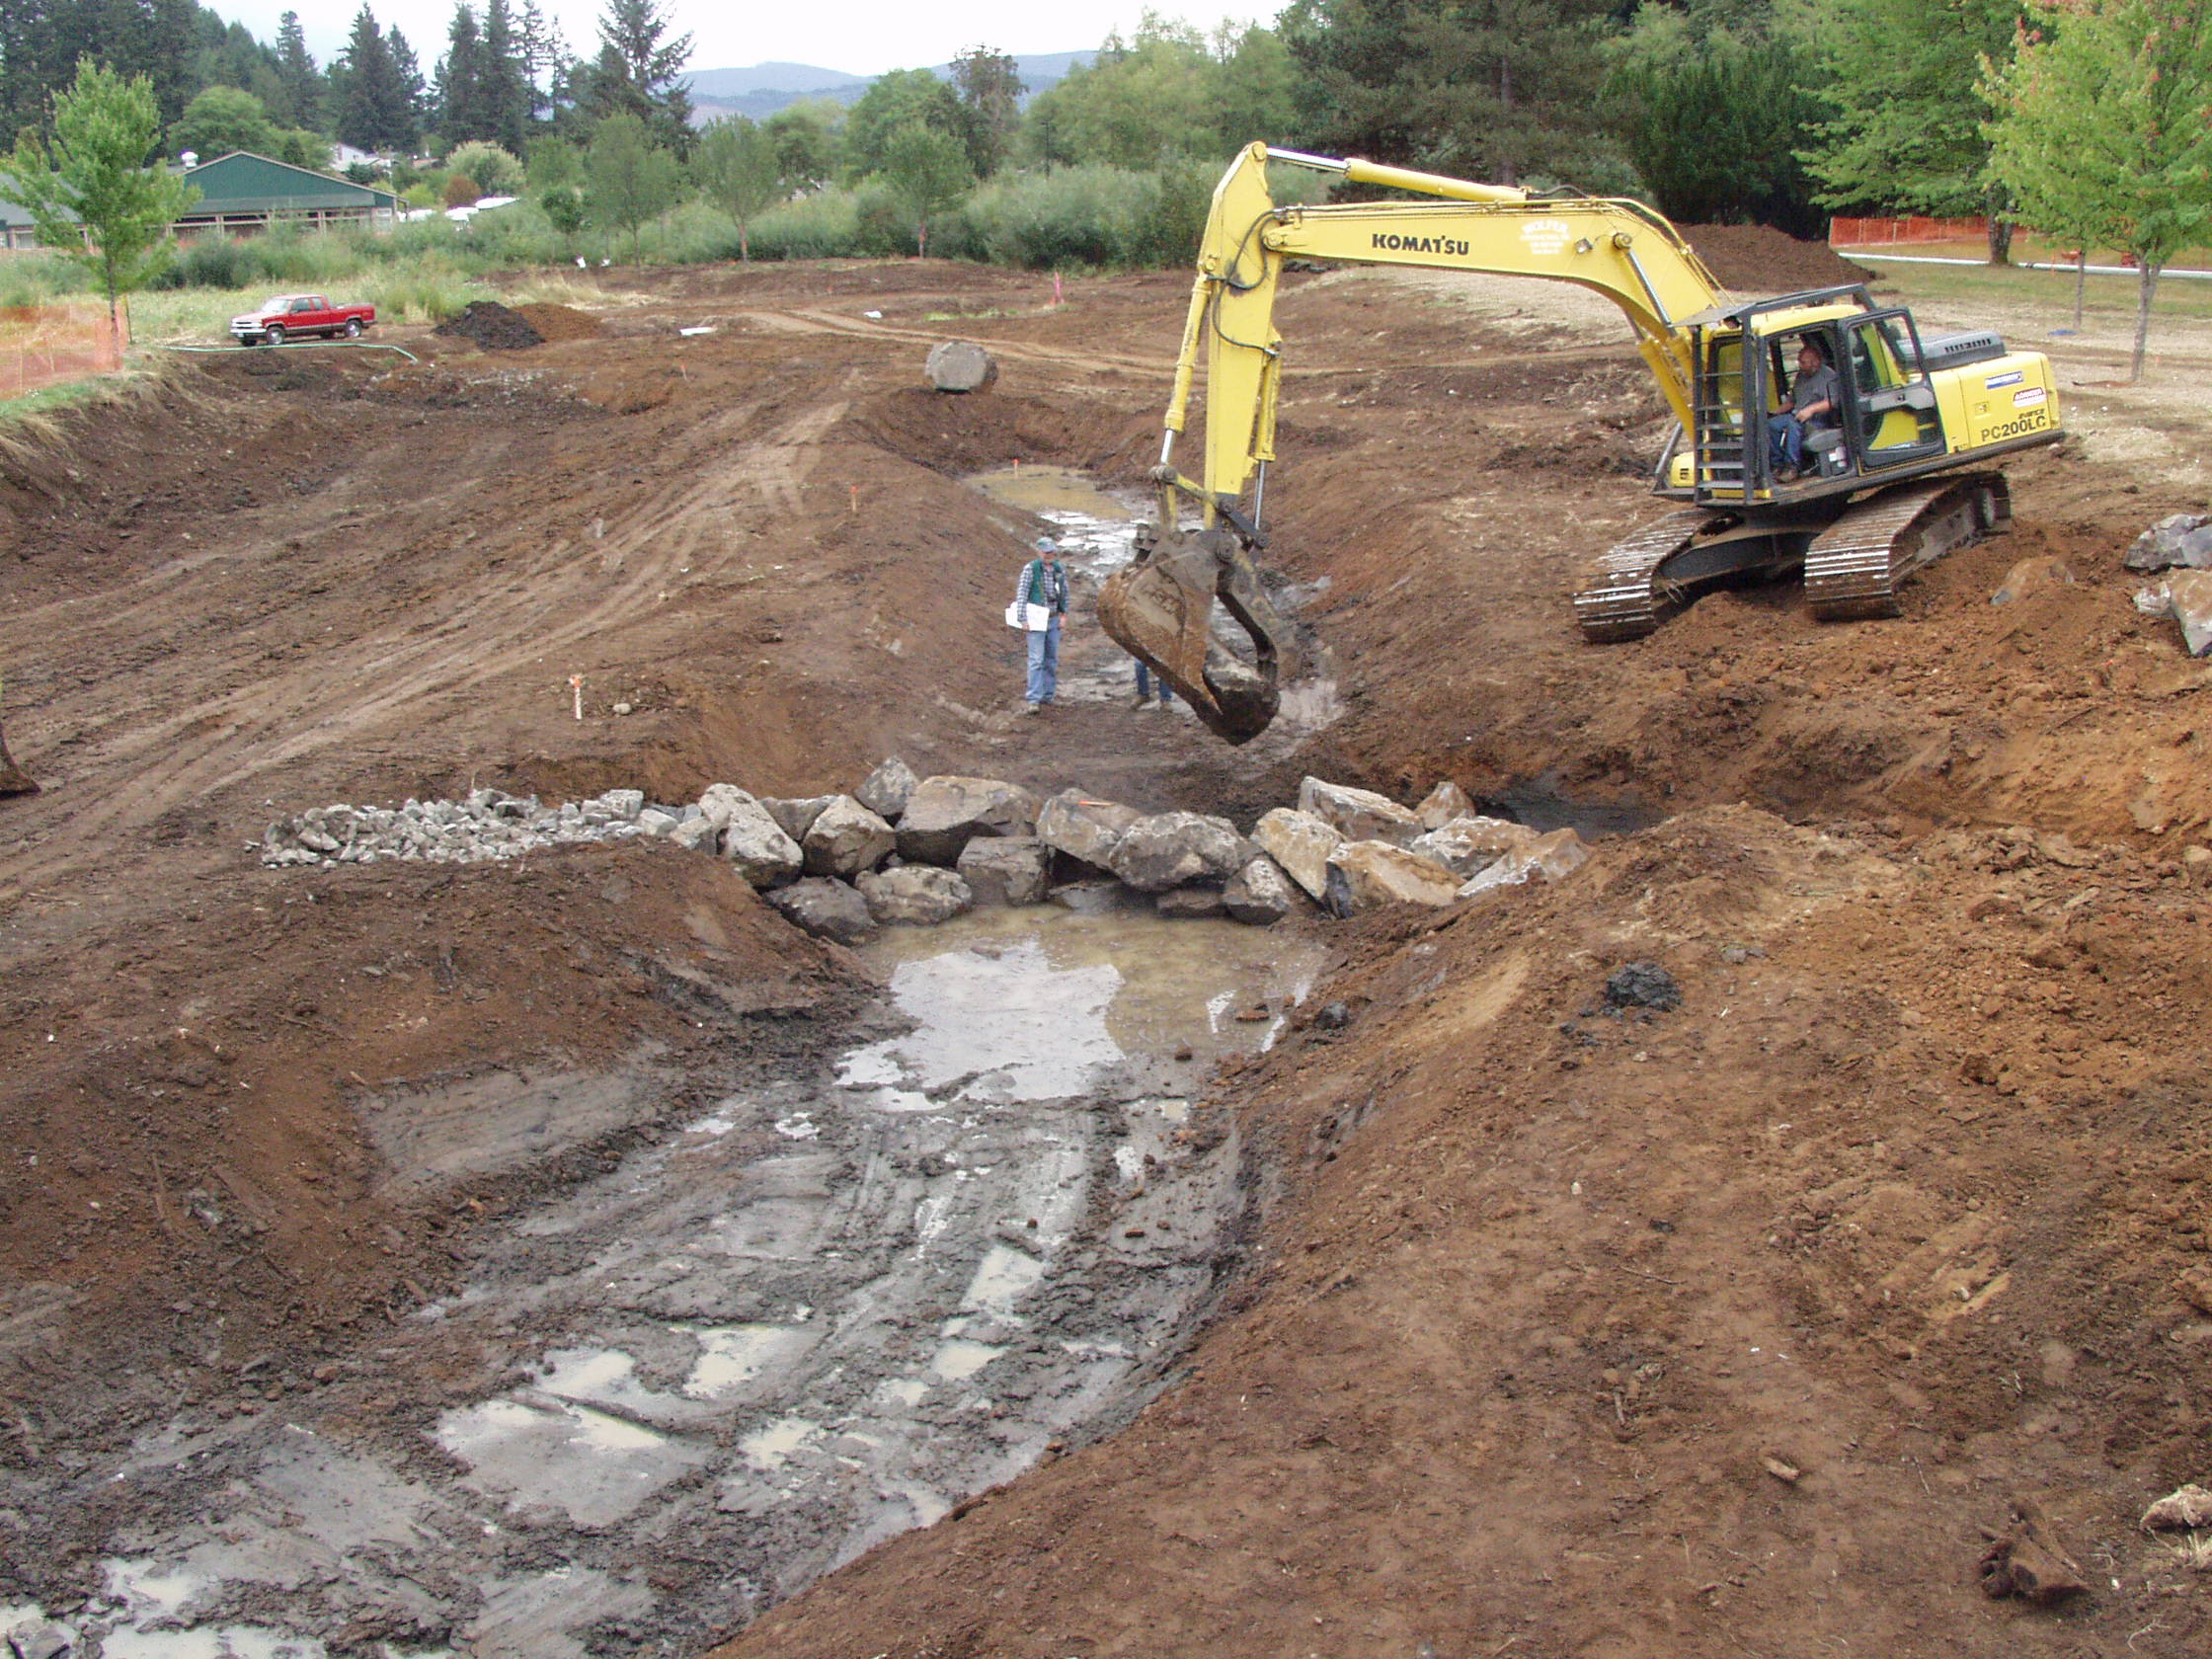
Constructing a rock weir |
|
|
|
|
|
Oetter,
D.R., Askenas, L.R, Gregory, S.V., and Minear, P.J. 2004 . “GIS
Methodology for Characterizing Historical Conditions of the Willamette
River Flood Plain, Oregon.” Transactions in GIS, 8(3):
367-383 |
|
|
|
This
paper discusses the changing floodplain and riparian area of the
Willamette River since European settlement in the Willamette Valley in
the mid-nineteenth century, and a quantitative method of analysis for
prioritizing floodplain restoration and conservation. The
authors used digitized survey maps of the Willamette River from 1850,
1895, and 1932, in addition to orthophotographs from 1995 to identify
main channel delineation, channel complexity, and dams or revetments
along the banks. Additional data on flood plain vegetation was
acquired from 1850 and 1995. The authors analyzed the GIS layers,
and established that due to human manipulation, the Willamette River
has lost much of its sinuosity, side channels, and floodplain
vegetation, particularly in the upper reaches between the cities of
Eugene and Albany. Analyzing these historic data gives planners
and managers a useful tool in prioritizing floodplain restoration
efforts and targeting areas for restoration that had high levels of
floodplain complexity and are not currently overdeveloped. |
|
|
|
Parisi,
D, Taquino, M., Grice S.M., and Gill D.A. 2003. “Promoting
Environmental Democracy Using GIS as a Means to Integrate Community
into the EPA-BASINS Approach” Society and Natural Resources, 16:205-219 |
|
|
|
This
fascinating paper casts a social science dimension on to watershed
management, a variable that is too often ignored by watershed
managers. The authors use the Environmental Protection Agency’s
(EPA) BASIN model, which advocates that a holistic view of ecological
and physical conditions of unique watersheds should drive management
systems instead of a “one-size-fits-all” approach. This paper
argues for an even more inclusive management regime which takes into
consideration socio-economic factors. In the study, communities
in Mississippi are defined (<10 minutes from an established center)
and identified using GIS, watershed boundaries are established, and a
sample watershed is chosen for analysis which has an urban, wealthy,
and educated sub-watershed downstream of a more rural, extraction-based
sub-watershed that lacks its downstream neighbor in most socio-economic
variables. However, and contrary to many expectations, when
residents are sampled during a survey measuring “community action
toward the environment”, the results show that the rural sub-watershed
had a higher level of community activeness toward environment
issues. This is important research, as it contradicts
social expectations for watershed restoration and management.
Incorporating this social model into a management strategy should
assist in achieving community support and reducing hostilities over
natural resource issues. |
|
|
|
Richey,
J. 2001. “Spatial Techniques for Understanding Commons
Issues”. In Protecting the Commons: A Framework for
Resource Management in the Americas, edited by J. Burger, E. Ostrom,
R.B. Norgaard, D. Policansky, and B.D. Goldstein, 273-291.
Washington DC: Island Press |
|
|
|
As
human civilization has become more complex, resources in many areas
have become scarce, with multiple actors competing for limited
supplies. Global growth in population and economies, in addition
to the unknown extent that water resources will be impacted by climate
change will put increasing demands on policy makers to ensure that
resources are allocated, protected, and managed in an equitable and
efficient manner. As the article notes, government policy and
laws are rich in language, but often poor in quantitative criteria with
which evaluations can be made. In addition, the public is often
faced with a confusing maze of regulatory agencies at all levels of
government, which may be acting without accordance (or even competing)
with regards to natural resource management. Thus, Richey argues
for a numerate ethics, which seeks to synthesize various scientific
disciplines to create a more equitable and efficient manner to allocate
the increasingly scarce resource of water. To assist in the
creation of this paradigm, management regimes should begin by adopting
a watershed model that bypasses arbitrarily drawn political
boundaries. Once this has become the standard, GIS has tremendous
potential as the tool to capture, store, and analyze a vast array of
data important for decision-making. These quantitative data will
not only make for a more equitable and fair allocation of resources,
but also more transparent as citizens are able to access GIS through
web-based portals. |
|
|
|
 |
|
|
|
Steel
E. A., Feist B. E., Jensen D.W., Pess G. R., Sheer M. B., Brauner J. B.
and Bilby, R. E. 2004. “Landscape models to understand steelhead
(Oncorhynchus mykiss) distribution and help prioritize barrier removals
in the Willamette basin, Oregon, USA.” Can. J. Fish. Aquat.
Sci./J. Can. Sci. Halieut. Aquat. 61(6): 999-1011 |
|
|
|
|
|
In
this study, a model was created to predict winter steelhead redd
densities in four Willamette Valley watersheds. Numerous
landscape GIS layers were assembled, and a linear mixed model developed
to assist in prioritizing fish passage barrier-removal in the
Calapooia, South Santiam, North Santiam, and Mollala watersheds.
The findings suggested that landscape features such as geology,
vegetative cover, and climates were good predicators of redd locations,
thus suggesting that the model would be beneficial for managers and/or
restoration groups seeking to prioritize fish passage barriers.
Interestingly, the model predicted five barrier locations which do not
have significant upstream habitat blocked (in terms of total stream
length), but offer high predicted redd densities, which likely would
have been missed during standard analysis for fish passage. |
|
|
|
|
|
Villeponteaux, J. and Elder, D. 2000. “Management Assessment: Roads Crossing Inventories Using GPS and GIS.” Proceedings of the Twentieth Annual ESRI User Conference |
|
|
|
|
|
The
authors (and project coordinators) describe an agency-community group
partnership that resulted in a road crossings assessment using GIS to
assist in prioritizing efforts. Road crossings in the Klamath
National Forest, where the assessment took place, are a large
contributor of fine sediment to fish-bearing streams which degrades
critical habitat. Crossings also alter stream hydrology, create
habitat fragmentation, and can impede the passage of woody
debris. To assess the problem, the project partners used aerial
and field data to identify all road crossings within the
watershed. From there, the partners created a prioritization
process for treating problem crossings. Using criteria such as,
“risk of failure”, “consequence of failure”, “potential impacts”, and
“opportunity” for treatment, over 800 sites were identified, mapped,
and ranked in order of priority for treatment. Utilizing GIS
technology, the partners were able to conduct a successful and
efficient inventory to prioritize future restoration projects. |
|
|
|
|
Adding coarse woody debris, rock barbs and planting native vegetation helps control erosion and provide fish habitat |
|
|
|
|
|
|
Websites of interest for using GIS to prioritize watershed restoration projects |
|
|
|
Benton Fish Passage Program |
|
|
|
 |
|
|
|
|
This
innovative program utilizes GIS as both a mapping and analytical tool
to prioritize fish passage barriers in Benton County, Oregon. It
is unique in that volunteers gather data using GPS units, and following
ODFW fish passage criteria. Once data is collected, it is entered
into the GIS, where barriers are prioritized using a variety of
physical, biological, and social criterion. |
|
|
|
|
|
Bureau of Land Management (BLM) |
|
|
|
|
|
The
BLM maintains a web-based GIS database that features data layers that
cover mainly BLM land. However, some private land that is
adjacent to BLM-managed areas is included, which is important when
planning projects with a watershed perspective. Data layers
available include: critical spotted-owl habitat, 10 M Digital
Elevation Maps, and noxious and invasive weed inventories. |
|
|
|
|
|
Oregon Department of Fish and Wildlife (ODFW) |
|
|
|
|
|
ODFW
offers several GIS datasets useful for prioritizing watershed
restoration projects, particularly those which impact niative migratory
fish. For instream and riparian projects, a fish distribution
dataset is useful for prioritizing projects with ESA-listed fish
species, and to ensure regulatory compliance. For prioritizing
fish passage projects, ODFW has a fish barriers dataset, though it should be cautioned that the data was collected in the late 1990s and does not include private lands. |
|
|
|
|
|
Oregon Watershed Enhancement Board (OWEB) |
|
|
|
|
|
The
Oregon Watershed Enhancement Board (OWEB) offers a GIS watershed
council boundary dataset, and links to the Oregon Geospatial
Clearinghouse. The website also contains restoration priorities by subwatershed which show what watershed councils see as the main limiting factors in their respective watersheds. |
|
|
|
|
|
|
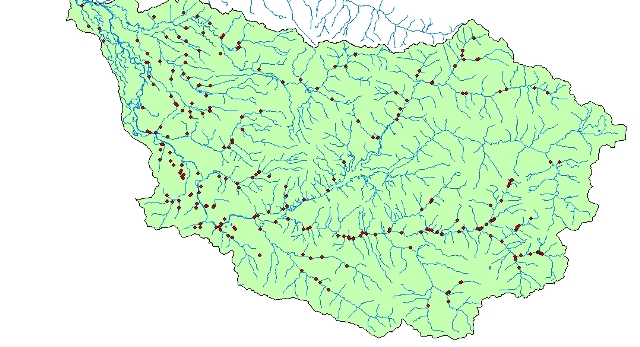
Known fish passage barriers in the South Santiam Watershed |
|
|
|
U.S. Fish and Wildlife Service (USFWS) National Wetland Inventory |
|
|
|
The
USFWS offers this on-line mapping service that allows the user to
interact with raster and vector wetland data. The user can zoom
to investigate delineated wetlands and historic wetland presence at the
local level. The site also offers wetland shapefiles for
download, which allow the user additional level of data manipulation
and analysis. |
|
|
|
Watershed Restoration |
|
|
|
This
handy paper transcends the myriad of regulatory agencies to show what
types of GIS data are available, and where they can be found.
This site should be of particular interest to those in the Western
United States. |
|
|
|
Willamette Basin Explorer |
|
|
|
This
website is an interactive web-based GIS of Oregon’s Willamette
Basin. It offers the user a wide range of mapping and analytic
tools in studying many of the Basin’s natural and political
features. There are many layers of particular importance for
restoration planning, including aerial photos, wetland delineation,
fish and wildlife presence, and historic river channels. |
|
|
|
Comments, questions, or suggestions? Contact the author at: sswc@centurytel.net |
|
