Geo265:
|
|
Part 1: Working with grid themes
In this exercise you'll display, query, and chart charcteristics of grids in ArcGIS 8.x.
In this exercise you'll learn:
· How to interpolate new grids from a set of points.
· How to manage and save data for these new grids.
· How grid themes differ in display and table handling
|
|
Start ArcMap
Load the Spatial Analyst extension
1. From the Tools Menu choose Extensions
2. Click in the check box labeled Spatial Analyst, then press the CLOSE button on the Extensions dialog to load the extension.

3. Click on the View menu and click on
Toolbars.
4. Scroll down to the Spatial Analyst
toolbar and click on it so a check mark appears next to it.
5. The toolbar will then be available
for you to dock within the ArcMap interface.
6. From the Spatial Analyst toolbar, select Options. Under the General tab, set your working directory
to the appropriate pathname. This will save all your output grids to your working directory.
Add Data
1. Press the Add Data button.
2. Navigate to the AVTUTOR directory. Double click on the Spatial directory under the AVTUTOR directory.
3. Double Click on Elevgrd to add it as a data layer.

Change the colors of the display
The colors of the display are easy to change, and specialized color ramps are provided for common data such as elevation.
1. Right click on the Elevgrd layer in the Table of Contents and click on
Properties. A warning message will then pop up on the screen- ignore this
warning and click OK. 
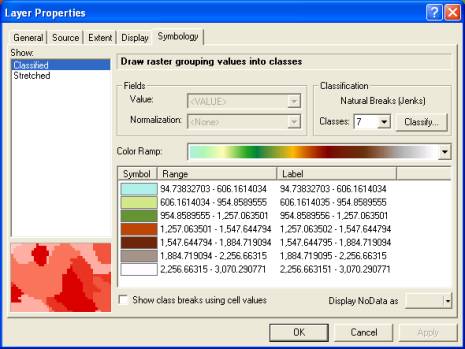
2. Click the Symbology tab.
3. On the left side of the Symbology box under the Show window choose Classified.
4. For the number of Classes drop down box choose 7.
5. Choose a white to green Color Ramp.
6. Click Apply.
7. Click Ok. This will close the Properties dialogue for the layer.
The legend has now been updated to reflect the new classes and color scheme. Take some time to become familiar with the Symbology tab in the Layer Properties menu. Double clicking on a symbol in the Table of Contents for a specific layer will bring up a color palette, which can be used to change the color of individual symbols or classes.
Each cell in a grid layer has a value which puts it into one of the classes in the legend. Each cell is filled with the color of its class, solid fill only. Changing the fill pattern won't change the display. The grid layer will always display with solid fill.
Giving the display depth
You can create composite displays of two layers; One layer, such as elevation, provides the color, and another layer, such as a hillshade, provides the brightness.
1. Add the grid data set hillshade to the Data Frame. (it's located in the spatial directory of the AVTUTOR data directory.) This is a grid of hillshade values for the elevation grid you are working with at the moment.
Note that you could create your own hillshade layer by using the Surface Analysis Hillshade command in the Spatial Analyst extension.
2. After adding the hillshade layer, move it to the bottom of the Table of Contents, below the Elevgrd layer. (Hint: make sure you are on the Display tab of the Table of Contents and not the Source tab.)
3. Right click on the Elevgrd layer and choose Properties.
4. Click on the Display tab.
5. In the transparency box type in 50. This will make the Elevgrd layer 50% transparent allowing us to see the layer below it.
6. Press Apply on the Layer Properties window to save the setting.
7. Click OK to close the Layer Properties window.


View the distribution data
1. Right click on the Elevgrd to view the layer context menu.
Notice that the Open Attribute Table option is not available. The Elevgrd layer is a floating point grid layer and does not have a table associated with it.
2. On the Spatial Analyst toolbar make sure the Elevgrd layer is selected in the pull down menu and then click on the histogram button to view a distribution of the values within the Elevgrd layer.
The x axis displays the classes in the Elevgrd theme's legend, and the y-axis shows the number of cells, or COUNT, in the Elevgrd theme for each class.

3. Close the Histogram of Elevgrd window
Derive slope from the elevation layer
It is easy to perform analysis to create new grid layers. Suppose you want to map the steepness of slopes from an elevation layer.
1. On the Spatial Analyst toolbar make sure the Elevgrd layer is selected from the drop down menu.
2. From the Spatial Analyst drop down menu click on Surface Analysis and then click on Slope.
3. The Slope calculation window will pop up. Make sure within this window the Elevgrd data layer is selected.
4. Leave all the options to default. 
5. Click OK.
6. The new slope layer will automatically draw as the first layer in your Map document and is given the name ‘Slope of elevgrd’ by the software.

This shows how easy it is to create new data layers from your existing data sources. The operations on the Surface Analysis menu of the Spatial Analyst toolbar work on the layer selected in the toolbar for the most part. Notice that you are not responsible for assigning an output name for the new data created. A name describing the action taken is supplied automatically for you by the software.
Rename the new grid layer
The name of any layer can be changed with the Layer Properties dialog.
1. Right click on the Slope of elevgrd layer and click on Properties.
2. Click on the General tab.
3. Change the Layer Name to Slope.
Notice some of the other properties that a grid layer has by clicking on the Source tab. You will notice that for this grid layer the Data Type is Floating point and the Status is Temporary.
4. Click OK on the Theme Properties dialog to apply the changes
Notice the change in the layer's name in the Table of Contents.
Reclassify the slope layer
You can convert the floating point grid layer, Slope, into an integer grid layer by classifying its values into groups. You might do this to change the slope layer into a layer representing building suitability based on slope.
1. In the Spatial Analyst toolbar, make sure the Slope layer is selected in the drop down menu.
2. From the Spatial Analyst drop down menu choose Reclassify…
3. Click the Classify button on the Reclassify Values dialog. 
4. Change the method of classification to Natural Breaks (Jenks) and set the Number of classes to 5 and Click OK.
5. Click OK on the Reclassify Values dialog, and again the newly created
grid layer will draw on the Map document automatically. 
Explore the table of slope attributes
You can make selections from a table that will highlight areas in the grid layer display.
1. Right Click on the Reclass of Slope layer.
2. Click on the Open Attribute Table command to view the attribute table.
3. Click on the furthest left column of the table, which will select a row in the attribute table.
Notice that when you select one row in the table, multiple regions of the map are selected and highlighted. This is because there is one record in the table for all grid cells with that value, even if they are not physically connected.
Holding down the control button and clicking on a row in the table will add it to the selected set.

Selection on a grid layerSince every cell in an integer grid layer does not have a separate record in its table, you are not able to select cells directly in the map. If you were to select a cell in the map, it would select the record containing the value of the cell in the table. Since this same record is used for multiple cells, all cells with this value would then be selected in the map. To prevent this confusion, selection on an integer grid layer can only be made from the table. |
WHAT TO TURN IN
In your
lab write-up:
1. discuss the two types of grids and their main
characteristics using the information provided in this lab as well as your
textbook and ArcView Help topics.
2. When you loaded the Spatial Analyst Extension
the user interface changed to add additional functions. Exploring the user interface and using your
textbook and the ArcView Help topics list and briefly describe the types of
analyses/functions that can be carried out with Spatial Analyst.
3. Create a flowchart of ALL the processes
carried out in this part of exercise 7.
One layout with two data frames: one of elevgrd
and one of the reclass of slope.
Remember
the six cartographic elements for each layout.
Also
hand in your lab notebook.
Part 2: Creating and analyzing surface data
As a large corporate farmer, you want to understand the soil chemistry of your fields so you can more accurately apply the necessary amounts of chemicals. Using point measurements, you'll create a surface of potassium content for a field. From this surface you'll create contours that will show where you need to apply more potassium.
In this chapter you'll learn:
· How to turn point measurements into a continuous surface.
· How to create an alternate surface representation using lines.
Load data into a new Map Document
1. If necessary, start ArcMap and choose to create a new empty map.
2. Make sure the Spatial Analyst extension has been loaded.
3. Add the shapefiles soilsamp.shp and thefarm.shp to the map from the Spatial directory of the AVTUTOR data directory. [Ignore the warning message about missing spatial reference information- click OK on this message.]
4. Draw the Soilsamp.shp layer.
5. Determine the minimum and maximum values of the attribute “soil_k” (potassium) in the soilsamp.shp theme. What are these values?
6. Edit the symbology of soilsamp.shp to change the legend type to a graduated color. Classify the attribute “soil_k” using 5 classes of quantiles.
7. Change the symbology of the farm.shp so that only the outline is displayed.
8. Add the grid theme DEM (digital elevation model) from the spatial directory.
9. Change the symbology to depict elevation change (you decide on the symbology).
10. With the DEM and the soilsamp theme on, study the distribution of potassium concentrations across the field
Create a potassium surface from point samples using the Spline Interpolation
Your soil samples are measurements scattered across the field. You want to create a continuous map of potassium for every location across the field.
1. On the Spatial Analyst dropdown menu click on Options. The Options window will pop up where you can specify the extent of the new raster layers you are creating as well as the cell size for the new rasters.
2. On the General Tab of the Options window set the working directory to your class directory. This is specifying that all raster data sets made with the extension will be saved in the correct location.
3. On the Options window click on the Extent tab. On the dropdown menu for Analysis Extent choose ‘Same as Layer “thefarm”.’
4. Next click on the Cell Size tab and in the Analysis cell size dropdown menu select ‘As specified below’.
5. Type in 100 in the ‘Number of Rows’ box and the other boxes will be automatically populated by the software.
6. Click OK on the Options window.
7. From the Spatial Analyst dropdown menu click on Interpolate to Raster and click on the Spline command.
8. On the Spline dialog, make sure the Input points: layer is SOILSAMP and set the Z Value Field: to Soil_K and let the other fields default.
9. Click OK at the bottom of the dialogue.

10. Draw the newly created grid layer will automatically be drawn for you. Change the name of the grid to “Spline surface”
11. Edit the symbology to use a
stretched legend type. Stretch
“Value” using standard deviations with breaks at 1 std dev.
12. What is the mean value of
potassium content as derived from the spline interpolation?

Each cell in the resultant grid layer contains an estimate of potassium content for that location based on the potassium content of the points surrounding it.
Setting and using Analysis PropertiesIn the exercises above, you are responsible for setting the extent and cell size of the output grid (with suggested defaults) using the Options dialogue of the Spatial Analyst extension. This must be done before every Spatial Analyst operation is applied to a layer. In most cases you will want to carefully select a fixed extent and cell size for analysis so that all analyses and output will be at this resolution. In your lab writeup, briefly describe the Analysis Properties and their
parameters that must be set before carrying out any analysis. Use the Help topics as well as other
resources. |
Create another potassium surface using Inverse
Distance Weighted (IDW) interpolation
1. Repeat the interpolation process above but this time, in the Interpolate
to Raster menu, choose the Inverse Distance Weighted
command.
2. As before, make sure the Input points: layer is SOILSAMP and set the Z Value Field: to Soil_K. The power field should be set to 2. The search radius type should be set to Variable and the number of points that will be used for each search should be 12. Leave all other values as the default.
3. Change the symbology of this grid layer as outlined above.
4. What is the mean value of potassium content as derived from the IDW interpolation?
5. Change the name of the layer to “IDW surface”.
Create contours of a surface
1. From the Spatial Analyst dropdown menu click on Surface Analysis and choose the Contour… command.
2. Change the contour interval to 100 and let the other parameters default.

3. Click OK on the Contour dialog.
4. The new layer will automatically draw on the map.

Now you can look at the content of the potassium in your field as a continuous surface or as a set of contours. If you wanted to keep the potassium level in your field above 300, you could use Raster Calculator in the Spatial Analyst extension to select all areas on your surface with potassium content lower than 300. This would tell you where potassium is low, but not how low. The contour theme tells you how low in potassium each area is.
Compare the results of the two interpolated
surfaces
1. Change the symbology of the two surface grids to identify differences between the interpolations. To do this, determine the mean value of the soilsamp values. Then for each grid, classify the grid into 2 classes. Check the show mean box in the classify dialog box (this is the mean value for the interpolated grid). Click on the blue bar in the histogram and move it to the estimated position of the mean value of soilsmap (this will be different from the mean value of the grid). Then click OK. Change the color symbology so that the two classes are distinct.
2. Use the identify tool to explore the values of these selected cells in the spline and IDW surface grid in comparison to the soilsamp values. Change between the layers by using the pull down menu in the identify results box.
3. Turn on both surface grids and then turn the top grid off and on to compare the differences in the surfaces.
4. Comparing the two interpolated surfaces, which interpolation method seems to produce a surface that more closely matches the original data from the soilsamp theme?
5. Study the range of interpolated values derived from these two interpolation algorithms. What is the significance of the differences in these interpolated values, especially in comparison to the values from soilsamp.shp?
*WHAT TO TURN IN:
Lab
Report with answers to the questions posed in the lab. In addition, create a flowchart of ALL the
processes carried out in this part of exercise 7.
One
Layout with two data frames: One data frame of the Spline surface with contours
and soilsamp and another with IDW surface, contours and soilsamp. Remember the six cartographic elements
Lab Notebook
Last updated
http://dusk.geo.orst.edu/arc/raster/