
Page 50 - GIS for Science: Technology Showcase
P. 50
SENTINEL-2 IMAGERY VIEWER
Dramatic events like the Camp Fire that nearly destroyed the California town of Paradise are recorded by satellite platforms that continuously orbit Earth. The satellites deliver a stream of imagery and remote-sensing data that helps people understand how the earth changes over time. One of these systems, Sentinel-2, is a set of twin satellites flying in the same orbit 180 degrees apart. The mission of Sentinel-2 is to collect wide-swath, high-resolution, multispectral imagery. The image data is used to manage land, agriculture, and forestry but also contributes to emergency management, humanitarian relief operations, and global security.
Sentinel-2 is part of Copernicus, the world’s largest single Earth-observation pro- gram directed by the European Commission in partnership with the European Space Agency (ESA). Sentinel-2 provides multispectral data spanning 13 bands in the visible, near-infrared (NIR), and short-wave infrared with spatial resolution ranging from 10 meters to 60 meters. Sentinel-2 continuously collects and pro- vides imagery for any land-based location in the world every five to seven days.
Imagery exploration and analysis
Sentinel-2, Landsat, and a vast library of contemporary and historical imagery is available through the ArcGIS® Living Atlas of the World. ArcGIS software and services provide additional access to enriched visualization, geospatial analyt- ics, and image exploitation tools.
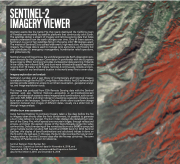
This image was produced from ESA Remote Sensing data with the Sentinel Explorer web app. Sentinel Explorer—accessible at sentinel2explorer.esri .com—provides quick access to many imagery band combinations, such as nat- ural color, NIR, SWIR, and other indices for visualizing vegetation, moisture, and burn scars on the landscape. Sentinel Explorer allows users to perform change detection between two images of different dates, visually via a slider tool, or through image analysis.
Wildfire burn area assessment
Using Sentinel Explorer to compare imagery taken a few days before the fire to imagery taken shortly after the fire’s containment, it’s possible to generate a burn index (shown in orange). The burn index displays the detailed burn pat- tern of the Camp Fire, which spread over mountain ridges, through valleys and arroyos, and down the western slopes of the Sierra Nevada range into valley communities. Default rendering of the normalized burn ratio (NBR) is computed using multiple bands including NIR band 8 and SWIR band 12. With Sentinel Explorer, this display of band combinations and calculated indices is done on the fly within the web app. In this case, the burn index overlays the natural color imagery taken by Sentinel 2 several days after the fire was contained. The town boundary of Paradise is shown for reference.
Sentinel Explorer: Peter Becker, Esri
Data source: Copernicus Sentinel data for November 6, 2018, and December 6, 2018. This map contains modified Copernicus Sentinel data for November 6, 2018, and December 6, 2018.
234 GIS for Science
