
Page 39 - GIS for Science: Technology Showcase
P. 39
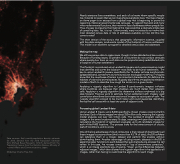
  Data sources: Esri’s world population density estimate for 2016, derived from the 2016 Population Estimate from Michael Bauer Research, GmbH, derived from the Population Census from the Statistics Bureau, Ministry of Internal Affairs and Communications, Japan.
Modeling: Charlie Frye, Esri.
Nearly everyone lives somewhere, and each of us knows where specifific people live. It stands to reason that we can map where everybody lives. The map of Japan on these pages is an excerpt from a global map that is beginning to prove this reasoning. National governments take censuses. To support that work and many other governmental functions, they maintain lists of addresses where people live. Thus, it’s easy to presume that making this map would be a relatively simple task of compiling data. Yet, it is not. Unfortunately, many countries do not make their most detailed census data or lists of addresses available, so how did this map come to exist?
The short version of the story is that geographic information science, coupled with big data analysis, produced a model of the footprint of human settlement. This model is an excellent surrogate for detailed census data and addresses.
Making the map
We still use census data to make maps, though it is less detailed and less current. Because of funding issues, 55 percent of all countries do not conduct censuses where people live. Even so, such data can be proportionately redistributed onto a footprint of human settlement.
That footprint is produced using Landsat 8 imagery and a geoprocessing model that identififies and scores the locations most likely to be human settlement. The key to using Landsat 8 imagery, specififically the 15-meter cell size panchromatic (grayscale) band, comes from a surprising source: ecological modeling. Ecologists know that the roughness of terrain is an important characteristic for defifining the habitats of plant and animal species. Rugosity algorithms are applied to elevation models of Earth to describe how rough the terrain is in a given locale.
Applying a rugosity algorithm to Landsat 8 panchromatic imagery indicates where buildings are because their shadows are much darker than adjacent cells. Applying a rugosity algorithm (to determine surface roughness) is a big step forward. Previous work to estimate human settlement with imagery used convolution algorithms that rotate sections of imagery to count pairs of cells. The rugosity algorithm proved to be much faster and could guarantee identifying fifive-by-fifive cell areas with at least two pairs of adjacent cells.
Processing global Landsat 8 data
Using Landsat 8 means using 8,600 specififically chosen images covering Earth’s land area. Each of those images has about 250 million cells, meaning the rugosity model analyzes just over two trillion cells. The Landsat 8 program captures images in the same locations every 16 days, meaning each year the process for calculating the footprint of settlement evaluates up to 22 candidate images for each of the 8,600 locations. The process looks for the lowest amount of clouds, leaf-off conditions, and no snow.
One of the big advantages of cloud computing is that instead of downloading all these images to process them (that’s more than 4.5 TB of data), ArcGIS software can reference them in a mosaic dataset and perform the analysis without downloading them. Another advantage of using mosaic datasets in ArcGIS is assigning raster functions to each dataset that automatically pre-process the cell values. In this case, the process computed a “top of atmosphere correction,” which is an image scientist’s way of saying, “Clean up the differences between adjacent images,” which then allowed one rugosity algorithm to be applied to all images, rather than having to customize the algorithm for each image.
A Glacier in Retreat 223
