
Page 45 - GIS for Science: Technology Showcase
P. 45
Scientists and researchers often encounter the problem of unknown values within a range of known values. To solve this problem, they use mathematical and statistical methods to create or interpolate new data points. They use these data points to fill in the gaps and model phenomena occurring across a landscape or in 3D space. Researchers use interpolation to accurately predict values for new data points using the existing values of a limited number of sample data points where the measurements were gathered. Researchers have begun using Empirical Bayesian Kriging 3D, a geostatistical interpolation method developed by Esri, to get new estimated values between the known values, and then model the measurements in 3D.
Kriging
Kriging is a method of interpolation used in spatial analysis in which data points exist at specific locations in space and time. Each data point is defined by geographic coordinates (i.e., latitude, longitude, and often, elevation) and other measurements, such as the amount of particulate matter in the air. Kriging applies the basic principle that distributed data points are spatially correlated. This principle assumes that while everything is related to everything else, near things are more related than distant things.
Researchers can use kriging to predict unknown values for any data point, such as elevation, rainfall, chemical concentrations, and noise levels. Empirical Bayesian Kriging 3D is used when the data points are distributed within a geographic volume, such as a square-mile study area of an ocean, ranging from the ocean surface to the ocean floor.
Cross validation
Empirical Bayesian Kriging 3D provides cross-validation tools to assess how well the model predicts values at unknown locations. Cross validation removes a measured point and then uses all remaining points to go back to the location of the removed point. This process is called the “leave-one-out” validation method. The measured value at the hidden point is then compared to the prediction value from cross validation. The difference between these two values is called the cross-validation error and is performed on every input point.
Modeling dissolved oxygen levels in Monterey Bay
Recent research has established that global oxygen levels in the ocean have declined for decades. Dissolved oxygen is the essential ingredient for life beneath the surface of lakes, rivers, and oceans. Using data from the World Ocean Database (WOD) provided by NOAA’s National Centers for Environmental Information, researchers measured the levels of dissolved oxygen by sampling water at different locations in Monterey Bay on the California coast. From above, the sample locations would appear as dots on a map riding on a flat surface. However, researchers sampled at multiple depths at each location, leaving lots of distance between measurements, where dissolved oxygen levels are unknown. Researchers filled in the blanks using Empirical Bayesian Kriging 3D to interpolate the values between these known measurements and create estimated but reliable measurements at each sampling depth.
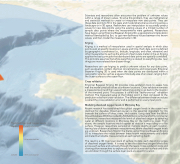
The result is a 3D map layer stack of surface models, each depicting ranges of dissolved oxygen levels. It is easy to see that dissolved oxygen levels vary across each surface and vertically through the layers. Cross-validation tools and charting allow researchers to explore any location across each surface and slide up and down through the surface layer stack at a specific location.
Predicted Dissolved Oxygen Levels Highest 6.35 micromoles/liter
3.35 micromoles/liter
Lowest 0.35 micromoles/liter
A Glacier in Retreat 229
