
Page 5 - GIS for Science: Technology Showcase
P. 5
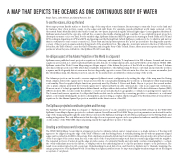
A MAP THAT DEPICTS THE OCEANS AS ONE CONTINUOUS BODY OF WATER
Bojan Šavric, John Nelson, and David Burrows, Esri
To see the oceans, slice up the land
Most maps portray Earth’s surface so that the edge of the map slices some features. Because maps commonly focus on the land and its features, they often portray oceans on the edges and split them. For example, pseudocylindrical world maps centered on the Greenwich Prime Meridian divide the Pacific Ocean into two parts, depicted along the left and right edges. Oceanographer Athelstan F. Spilhaus wanted exactly the opposite, with all the oceans in the middle, sharing a global coastline. To accomplish his goal, projection interruptions must occur over land. For the suitable edge, Spilhaus delineated half of a great circle starting in South China at 115°E and 30°N, ending in Argentina at 65°W and 30°S, and passing near the Bering Strait (which Spilhaus considered to be “so shallow and narrow that it constitutes no real oceanic connection.”). These start and end points represent the “poles” projected into the diagonally opposite corners of the projection square and absorbing much of the areal distortion. This edge also interrupts waters in the Sea of Okhotsk, the Bohai Sea, the Gulf of Mexico, near the Gulf of Panama, and along the Peru–Chile Trench. Hence, these areas are repeated at the ocean’s perimeter when they are crafted into the Spilhaus World Ocean Map.
An oblique aspect of the Adams Projection of the World in a Square II
Spilhaus never published exact projection equations for his map, unfortunately. To implement it in GIS software, forward and inverse equations are needed, not only for spherical Earth models, but also for ellipsoidal models, such as World Geodetic System (WGS) 1984. Spilhaus created his World Ocean Map using an oblique aspect of the Adams Projection of the World in a Square II. Oscar S. Adams introduced this projection in 1929, which has remarkable similarities to the Spilhaus map. Both are conformal and portray the world in a square, and both greatly distort areas near the two diagonally opposite corners. Distortions in the other two corners are smaller. Just like the Spilhaus map, the Adams projection can also be mosaicked into an infinitely continuous map of the world.
The Adams projection can be used to reverse-engineer Spilhaus’s exact configuration by setting the edge of the map near the Bering Strait. Adams derived the equations for his projection first by conceptually shrinking the world into a hemisphere while maintaining conformality. Then he applied elliptic functions previously used by Charles S. Peirce and Émile Guyou to project the curved surface onto a plane. Adams presented the forward equations for spherical Earth models only (and also only in an equatorial orientation). However, most of today’s geospatial data is defined based on ellipsoidal models, such as WGS 1984 or Geodetic Reference System (GRS) 1980. In modern GIS, one also needs the ability to convert projected data back to geographic coordinates, requiring inverse equations. The forward and inverse equations for ellipsoidal Earth models can be achieved by converting geodetic coordinates to a conformal sphere, conformally shrinking the model to a hemisphere, and resolving a complex elliptic integral of the first kind. Esri developed these equations for the Adams Square II projection, available in the latest version of ArcGIS.
The Spilhaus projected coordinate system and the map
The Spilhaus World Ocean Map in a Square or “Spilhaus projection” is also available in the latest ArcGIS software as the WGS 1984 Spilhaus Ocean Map in Square projected coordinate system. Its well-known ID is 54099. The projection parameters are derived from the edge of the map passing through the same three points used by Spilhaus, starting in South China, passing across the Bering Strait, and ending in Argentina. The only difference is that the edge does not represent a great circle on a sphere but rather a carefully crafted curve on the surface of the WGS 1984 ellipsoid passing exactly through all three points of the edge.
Creating a continuous world ocean map
The WGS 1984 Spilhaus Ocean Map in a Square projected coordinate system cannot repeat areas, so a single instance of the map will appear to be clipped along the edge of the Gulf of Mexico and the Bering Strait. A visually pleasing layout without apparent clipped edges can be crafted in ArcGIS in three steps. First, duplicate an already-styled map four times within a layout and position them at each of the four edges of the center map. Second, rotate each of the four perimeter maps such that its coastal edge aligns with its neighbor. The repeated portions of water along the edge provide a sense of continuity. Finally, and optionally, overlay a visual graphic to occlude the overly redundant areas in the layout, or simply position the underlying layout to clip the perimeter maps to your preference. The result is an uninterrupted world ocean map. Understanding its areal distortion, and therefore limitations for thematic mapping, the unique perspective of the Spilhaus World Ocean Map in a Square justifies its use for important, highly visual messages about the largest ecosystem of our planet.
