
Page 9 - GIS for Science: Technology Showcase
P. 9
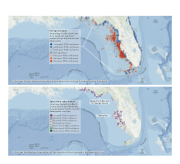
    Hot spot analysis
Areas along Florida's west coast show statistically significant clusters of high and low red tide observations.
Cold spot—99% confidence Cold spot—95% confidence Cold spot—90% confidence Not significant
Hot spot—90% confidence Hot spot—95% confidence Hot spot—99% confidence
          In this map, hot spot analysis shows where red tide observations are high (hot spots) and low (cold spots).
      Space-time cube analysis
Areas near Apalachicola Bay, St. George Sound, and Tampa Bay show an upward trend in red tide observations over time.
Up trend—99% confidence Up trend—95% confidence Up trend—90% confidence No significant trend
Down trend—90% confidence Down trend—95% confidence Down trend—99% confidence
Apalachicola Bay and St. George Sound
  Tampa Bay
          In this map, trend analysis shows where red tide observations have increased or decreased over time.
