
Page 16 - GIS for Science: Technology Showcase
P. 16
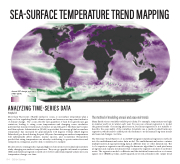
SEA-SURFACE TEMPERATURE TREND MAPPING
  Annual SST change over time (1981–2019)
Increase Decrease
ANALYZING TIME-SERIES DATA
Hong Xu, Esri
More than 70 percent of Earth’s surface is ocean, so sea-surface temperature play a major role in regulating Earth’s climate system and serves as an important indicator of climate change. The ocean absorbs vast quantities of heat from greenhouse gas emissions, leading to rising ocean temperatures and changing ocean circulation patterns that transport warm and cold water around the globe. The National Oceanic and Atmospheric Administration (NOAA) reports that the average global sea-surface temperature has increased by approximately 0.13 degrees Celsius (32.23 degrees Fahrenheit) per decade during the past 100 years. Increasing sea-surface temperatures will substantially affect climate, marine species, and ecosystems. Researchers predict that rising temperatures are already contributing to species extinctions and extirpations, rising seas, and flooded ecosystems, for example.
Modern remote sensing technology and high-resolution time-series data help scientists study changing sea-surface temperatures. They use geographic information systems (GIS) and statistical regression methods to better understand spatial variations in sea temperature change over time.
194 GIS for Science
Sea-surface temperature trend raster map (1981–2019).
 The method of modeling annual and seasonal trends
Many Earth science variables exhibit periodicity. For example, temperatures are high in summer and low in winter each year. You can use a linear regression to model the general trends of recurring phenomenon, but linear regression is not suitable to describe the seasonality of the variables. Scientists use a method called harmonic regression, which tends to exhibit periodic rhythms, to model annual long-term trends and seasonal changes over time.
The Generate Trend Raster tool in ArcGIS® integrates statistical regression methods into the multidimensional raster data model. The multidimensional raster contains multiple rasters along representing data at different time (or other dimensions). The tool computes a regression model using the harmonic algorithm for each pixel array along time and output a trend raster that contains the regression models of each time series. The regression model coefficients and the statistical terms such as root mean square error (RMSE), p-value, and R-squared are stored as bands in the output trend
