
Page 17 - GIS for Science: Technology Showcase
P. 17
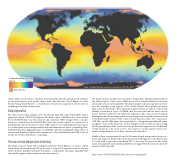
  Predicted monthly SST, 2050
Highest
raster which can be used to visualize seasonal trend, map the annual trend, evaluate model performance, and predict future data. The Generate Trend Raster tool and Predict Using Trend Raster tool built based on harmonic regression will be used in analyzing sea-surface temperature.
Data preparation
The data used in this analysis are from NOAA’s daily SST data (1981–2019) with a spatial resolution of 0.25 x 0.25 degrees. The data consist of 39 Network Common Data Form (NetCDF) files (one file per year) and represent 13,931 images. First, a mosaic dataset is created from the NetCDF files. Next, the mosaic dataset is converted to a multidimensional cloud raster format (CRF), which stores multidimensional rasters for optimal time-series image analysis and multidimensional raster computing. Next, daily SST data was aggregated into monthly SST data by averaging the pixel values of each month. Finally, analysts built a transpose for the multidimensional CRF to speed up the across-time dimension computing.
The sea-surface temperature trend map
The team created a trend raster using the Generate Trend Raster tool. In the output trend raster, the band named Slope is used to map the long-term trend as shown, where positive (purple) indicates sea-surface temperature increases annually with time while negative value indicates a decrease (green).
Lowest Masked pixels
Map of predicted sea-surface temperature (SST) by 2050.
  The trend map shows that the sea-surface temperature changes dynamically in the different parts of the ocean. While most of the domain exhibits an increase trend, the increase varies spatially. The darker purple indicates a greater increase rate. For example, some regions of the North Atlantic show greater increases than in the North Pacific. The long-term annual trend at a location of the North Atlantic Ocean has a slope of 0.00008, and the seasonal trend at that location is also clearly modeled by the harmonic regression. The ocean in the Southern Hemisphere also shows temperature increase in general except the decrease trend in the East Pacific Ocean off the coast of South America, where the occurrences of El Niño and La Niña cause the temperature to change dramatically and cause a negative slope in the harmonic model. Analysis of the model’s accuracy using the R-squared band of the trend raster shows that this regression model fits well overall except in some areas close to the equator or polar regions, where sea- surface temperature does not have obvious seasonal effect.
Finally, a layer was generated from the R-squared band using raster function to select and mask out pixels with less model accuracy (R-squared < 0.6). The Predict tool was used to generate a predicted SST of the next 30 years from the trend raster. Calculated from the predicted SST, the average SST will increase from 31.57 in 2019 to 32.01 by 2050.
Data source: NOAA/OAR/ESRL PSD, www.esrl.noaa.gov/psd.
