
Page 19 - GIS for Science: Technology Showcase
P. 19
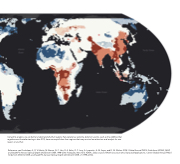
 Using this analysis, we can better understand whether regions that experience extreme pollution events, such as the wildfires that raged across Australia starting in late 2019, have worse pollution than regions that may receive less attention and analysis for one reason or another.
Reference: van Donkelaar, A., R. V. Martin, M. Brauer, N. C. Hsu, R. A. Kahn, R. C. Levy, A. Lyapustin, A. M. Sayer, and D. M. Winker. 2018. Global Annual PM2.5 Grids from MODIS, MISR and SeaWiFS Aerosol Optical Depth (AOD) with GWR, 1998–2016. Palisades, New York: NASA.; Data sources: NASA Socioeconomic Data and Applications, Center Global Annual PM2.5 Grids from MODIS, MISR, and SeaWiFS Aerosol Optical Depth (AOD) with GWR, v1 (1998–2016).
