
Page 20 - GIS for Science: Technology Showcase
P. 20
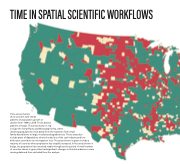
TIME IN SPATIAL SCIENTIFIC WORKFLOWS
  Time-series clusters
show counties with similar
patterns of population growth or
decline from 1969 to 2018. Three distinct
patterns emerge. The areas shown in red
include the Great Plains and Mississippi Delta, where
declining populations result partly from the transition from small,
family-based farms to large, mechanized agrobusiness. These areas also
include parts of Appalachia, where the decline of the coal industry and low
birth rates contribute to net migration loss. The areas shown in green include a majority of counties where population has steadily increased. In the areas shown in beige, the population has remained stable throughout the period. A small number of counties shown in gray either had significant changes in their boundaries or were missing data and thus excluded from the analysis.
Legend
Declining population Increasing population Stable population
No data
    198
GIS for Science
