
Page 18 - GIS for Science: Technology Showcase
P. 18
SPACE-TIME PATTERN MINING
EMERGING HOT SPOT ANALYSIS OF POLLUTION DATA
Lynne Buie, Esri
From massive wildfires that darken the skies over a continent to volcanic eruptions that leave big cities coated in ash, we regularly hear about—and sometimes experience—major pollution events. However, it’s not always easy to evaluate whether the pollution from these events is actually worse than anywhere else. The news media may over-report the news in a particular region and largely ignore what happens in another. Or a singular event may leave the impression that an area is heavily polluted when in reality, it may have clean air most of the time. What we do know is that pollution is harmful to human health. Pollution often contains microscopic particulate matter PM2.5, inhalable particles 2.5 micrometers or smaller in size, or about 30 times smaller than the width of a strand of human hair. Elevated levels of PM2.5 have been linked with increased infant mortality, and cardiovascular and pulmonary diseases such as asthma, lung fibrosis, and hardening of the arteries. Aside from the human costs, these and other pollution impacts from PM2.5 have an estimated financial impact of $225 billion per year globally in lost labor.
To get a clearer picture of pollution events, we can use data from Earth observation satellites to measure atmospheric and surface phenomena. One of those measurements is called aerosol optical depth (AOD), where the absorption or scattering of light in the atmosphere serves as a proxy for the presence and quantity of PM2.5. Van Donnkelaar et al. (2018) collected the annual AOD from three Earth observation satellites from 1998 to 2016. The researchers combined and refined the data using a chemical transport model and geographically weighted regression (GWR) with ground-based PM2.5 observations.
The global time series of annual PM2.5 pollution data across 19 years is a perfect candidate for space-time pattern mining using ArcGIS® Pro, which applies rigorous statistical tests to space and time data to find statistically significant patterns. The basis of the space-time pattern mining analysis is the space- time cube data structure—a method of representing temporal data as a multidimensional array appropriate for analysis.
With the PM2.5 pollution data in a space-time cube, researchers can apply the space-time pattern mining
technique called emerging hot spot analysis. This analysis allows researchers to objectively assess areas of high and low pollution by finding hot and cold spots in the global pollution data. A hot (or cold) spot is an area with high (or low) values
of pollution and surrounded by other areas of high (or low) values. Researchers assess each location in each time slice independently using the Getis-Ord Gi* statistic to determine whether the time slices are statistically significant hot or cold spots.
To incorporate the temporal component, researchers then apply the Mann- Kendall trend test to each location to assess the trend of hot or cold spots. This test results in nine different types of hot and cold spots, depending on the pattern of each location through time.
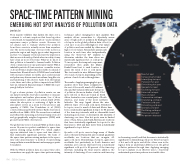
The results of applying emerging hot spot
analysis show that when compared to
the rest of the world, much of Southeast
Asia and Sub-saharan Africa are hot spots
of pollution (shown in shades of red). Cold
spots (shown in blue) are found in North
Africa, Australia, some coastal parts of South America, and many of the most northern latitudes. The map legend shows the nine different types of hot and cold spots. Persistent
hot spots, seen for much of Asia and Africa, have been a statistically significant hotspot for 90 percent of the time-step intervals, with no discernible trend indicating an increase or decrease in the intensity of clustering over time. New hot spots, seen in limited areas of Asia, Africa, and South America, are locations that have statistically significant hot spots for the final year in 2016 and have never been a statistically significant hot spot before.
Sporadic cold spots, seen in large areas of Alaska and northeastern Russia but also in small quantities worldwide, are locations that are on-again, off- again cold spots. Diminishing cold spots, again seen worldwide but particularly in South America and Australia, are locations that have been a statistically significant cold spot for 90 percent of the time-step intervals, including the final year.In addition, the intensity of clustering of low counts in each time step
New hot spot Consecutive hot spot Intensifying hot spot Persistent hot spot Diminishing hot spot Sporadic hot spot Oscillating hot spot Historical hot spot New cold spot Consecutive cold spot Intensifying cold spot Persistent cold spot Diminishing cold spot Sporadic cold spot Oscillating cold spot Historical cold spot No pattern detected
is decreasing overall, and that decrease is statistically significant for diminishing cold spots. These four types of hot and cold spots, and all the others seen in the legend, help us understand differences in the global pollution patterns through time. Applying emerging hot spot analysis is an effective way to objectively understand space-time patterns in scientific data.
196
GIS for Science
