
Page 21 - GIS for Science: Technology Showcase
P. 21
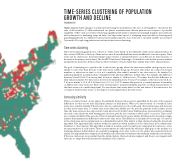
TIME-SERIES CLUSTERING OF POPULATION GROWTH AND DECLINE
Kevin Butler, Esri
Highly dynamic Earth changes on temporal scales range from minutes in the case of earthquakes to decades in the case of deforestation. To fully understand our planet, scientists must discern patterns across space—a powerful capability of GIS—and across time. Modern geographical information systems increasingly integrate new methods and techniques for analyzing temporal data. One important aspect of analyzing temporal data is detecting and quantifying patterns. Do different locations have similar patterns of an observed or modeled variable across time? One method for exploring patterns across time is time-series clustering.
Time-series clustering
Time-series clustering partitions a collection of time series based on the similarity of time-series characteristics. In the context of GIS, the collection of time series comes from individual time series at different locations in space. Time series can be clustered so they have similar values in time or similar behaviors or profiles across time (increase or decrease at the same points in time). The ArcGIS® Time Series Clustering tool identifies locations that are most similar and partitions them into distinct clusters, where members of each cluster have similar time-series characteristics.
The goal of clustering is to partition the locations into groups where the time series within each group are more similar to each other than they are to the time series outside the group. However, time series are composed of many numbers or values across time, so it is not completely clear what it means for two time series to be similar. For individual numbers, a useful measure of similarity is the absolute difference in their value. For example, the difference between 10 and 13 is 3. You can say that 10 is more similar to 13 than it is to 17 because the absolute difference in their values is smaller. For time series, however, the similarity is less obvious. For example, is the time series (5, 8, 11, 7, 6) more similar to (4, 9, 13, 4, 9) than it is to (5, 11, 6, 7, 6)? To answer this question, you must measure how similar or different two time series are. Each of the several ways to measure similarity depends on which characteristics of the time series you consider important. You can cluster time series based on the raw values of the time series, the correlation between time series, or the shapes of cyclical patterns in the time series.
Increasing similarity
When you cluster based on raw values, the similarity between time series is quantified by the sum of the squared differences in value across time (Euclidean distance in data-space). When you cluster based on correlation, time series are considered similar if they tend to stay in consistent proportion with each other and increase and decrease in value at the same time. To cluster time series that have similar smooth, periodic patterns in their values across time, the time series are decomposed into basis functions from the Fourier family and are represented by oscillating sine and cosine functions with varying periods; these periods are sometimes called cycles or seasons. Time series are considered similar if the periods of their dominant basis functions are similar. All three methods return a single number that measures the difference between two time series. This difference is calculated for every pair of locations in the study area and is summarized as a dissimilarity matrix. This matrix is then clustered using the k-medoids algorithm. This algorithm finds clusters within the matrix in which members of the clusters are more similar than members of other clusters. This algorithm is random in nature, and it works by choosing random locations to serve as representatives of each cluster. These representatives are called medoids, which are analogous to the median of a univariate dataset. Initial clusters are created by assigning every other location to the cluster whose medoid is most similar. The algorithm then swaps medoids within each cluster and reevaluates the similarity within the new clusters. If the new clusters are more similar than the initial clusters, the medoids are swapped, and the process repeats until there are no swaps that will increase the similarity of the clusters.
